Starbucks 2004 Annual Report Download - page 29
Download and view the complete annual report
Please find page 29 of the 2004 Starbucks annual report below. You can navigate through the pages in the report by either clicking on the pages listed below, or by using the keyword search tool below to find specific information within the annual report.-
 1
1 -
2
-
3
-
4
-
5
-
6
-
7
-
8
-
9
-
10
-
11
-
12
-
13
-
14
-
15
-
16
-
17
-
18
-
 19
19 -
 20
20 -
 21
21 -
 22
22 -
 23
23 -
 24
24 -
 25
25 -
 26
26 -
 27
27 -
 28
28 -
 29
29 -
 30
30 -
 31
31 -
 32
32 -
 33
33
 |
 |

40 Fiscal 2004 Annual Report
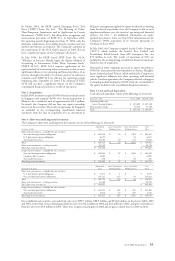
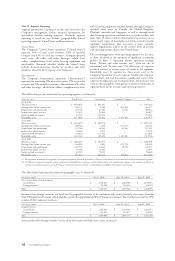
The table below presents information by operating segment (in thousands):
Fiscal year ended United States
(1) International
(1) Unallocated Corporate
(2) Total
Fiscal 2004:
Total net revenues $ 4,490,850 $ 803,397 $ – $ 5,294,247
Earnings/(loss) before income taxes 765,153 53,368 (194,264 ) 624,257
Depreciation and amortization 201,703 45,783 32,538 280,024
Income from equity investees 37,453 23,204 – 60,657
Equity method investments 14,367 138,144 – 152,511
Identifiable assets 1,273,807 474,832 1,570,318 3,318,957
Fiscal 2003:
Total net revenues $ 3,472,452 $ 603,070 $ – $ 4,075,522
Earnings/(loss) before income taxes 606,544 5,466 (175,675 ) 436,335
Depreciation and amortization 167,138 38,563 32,106 237,807
Income from equity investees 28,484 9,912 – 38,396
Equity method investments 16,919 117,422 – 134,341
Identifiable assets 1,161,512 383,324 1,184,910 2,729,746
Fiscal 2002:
Total net revenues $ 2,828,253 $ 460,655 $ – $ 3,288,908
Earnings/(loss) before income taxes 506,829 3,891 (171,721 ) 338,999
Depreciation and amortization 142,752 34,069 28,736 205,557
Income from equity investees 19,182 14,263 – 33,445
Equity method investments 18,519 76,101 – 94,620
Identifiable assets 957,127 332,411 924,854 2,214,392
(1) For purposes of internal management and segment reporting, licensed operations in Hawaii and Puerto Rico are included in the International segment.
(2) Unallocated corporate includes certain general and administrative expenses, related depreciation and amortization expenses and amounts included in
“Interest and other income, net” and “Gain on sale of investment” on the accompanying consolidated statements of earnings.
The tables below represent information by geographic area (in thousands):
Fiscal year ended Oct 3, 2004 Sept 28, 2003 Sept 29, 2002
Net revenues from external customers:
United States $ 4,501,287 $ 3,480,164 $ 2,830,650
Foreign countries 792,960 595,358 458,258
Total $ 5,294,247 $ 4,075,522 $ 3,288,908
Revenues from foreign countries are based on the geographic location of the customers and consist primarily of revenues from the
United Kingdom and Canada, which together account for approximately 81% of foreign net revenues. No customer accounts for 10%
or more of the Company’s revenues.
Fiscal year ended Oct 3, 2004 Sept 28, 2003 Sept 29, 2002
Long-lived assets:
United States $ 1,663,856 $ 1,544,300 $ 1,202,652
Foreign countries 295,827 261,417 239,097
Total $ 1,959,683 $ 1,805,717 $ 1,441,749
Assets attributed to foreign countries are based on the country in which those assets are located.
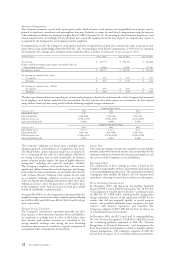
Note 19: Segment Reporting
Segment information is prepared on the same basis that the
Company’s management reviews fi nancial information for
operational decision making purposes. Starbucks segment
reporting is based on two distinct, geographically defi ned
operating segments: United States and International.
United States
The Company’s United States operations (“United States”)
represent 85% of total retail revenues, 83% of specialty
revenues and 85% of total net revenues. Company-operated
retail stores sell coffee and other beverages, whole bean
coffees, complementary food, coffee brewing equipment and
merchandise. Nonretail activities within the United States
include: licensed operations, foodservice accounts and other
initiatives related to the Company’s core businesses.
International
The Company’s International operations (“International”)
represent the remaining 15% of retail revenues, 17% of specialty
revenues and 15% of total net revenues. International sells coffee
and other beverages, whole bean coffees, complementary food,
coffee brewing equipment and merchandise through Company-
operated retail stores in Canada, the United Kingdom,
Thailand, Australia and Singapore, as well as through retail
store licensing operations and foodservice accounts in these and
more than 20 other countries. International operations are in
various early stages of development and have country-specifi c
regulatory requirements that necessitate a more extensive
support organization, relative to the current levels of revenue
and operating income, than in the United States.
The accounting policies of the operating segments are the same
as those described in the summary of signifi cant accounting
policies in Note 1. Operating income represents earnings
before “Interest and other income, net,” “Gain on sale of
investment” and “Income taxes.” No allocations of corporate
overhead, interest or income taxes are made to the segments.
Identifi able assets by segment are those assets used in the
Company’s operations in each segment. Unallocated corporate
assets include cash and investments, unallocated assets of the
corporate headquarters and roasting facilities, deferred taxes and
certain other intangibles. Management evaluates performance of
segments based on net revenues and operating expenses.