Starbucks 2004 Annual Report Download - page 7
Download and view the complete annual report
Please find page 7 of the 2004 Starbucks annual report below. You can navigate through the pages in the report by either clicking on the pages listed below, or by using the keyword search tool below to find specific information within the annual report.-
 1
1 -
 2
2 -
 3
3 -
 4
4 -
 5
5 -
 6
6 -
 7
7 -
 8
8 -
 9
9 -
 10
10 -
 11
11 -
 12
12 -
 13
13 -
 14
14 -
 15
15 -
 16
16 -
 17
17 -
 18
18 -
19
-
20
-
21
-
22
-
23
-
24
-
25
-
26
-
27
-
28
-
29
-
30
-
31
-
32
-
33
 |
 |

18 Fiscal 2004 Annual Report
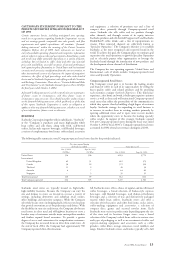
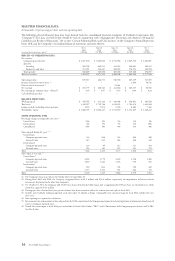
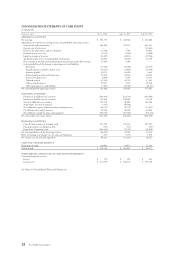
RESULTS OF OPERATIONS – FISCAL 2004 COMPARED TO FISCAL 2003
The following table sets forth the percentage relationship to total net revenues, unless otherwise indicated, of certain items included
in the Company’s consolidated statements of earnings:
Oct 3, 2004 Sept 28, 2003 Sept 29, 2002
Fiscal year ended (53 Wks) (52 Wks) (52 Wks)
STATEMENTS OF EARNINGS DATA
Net revenues:
Company-operated retail 84.2% 84.6% 84.9%
Specialty:
Licensing 10.7 10.1 9.5
Foodservice and other 5.1 5.3 5.6
Total specialty 15.8 15.4 15.1
Total net revenues 100.0 100.0 100.0
Cost of sales including occupancy costs 41.5 41.4 41.0
Store operating expenses (1) 40.2 40.0 39.7
Other operating expenses (2) 20.5 22.6 21.4
Depreciation and amortization expenses 5.3 5.8 6.3
General and administrative expenses 5.7 6.0 7.1
Income from equity investees 1.1 0.9 1.0
Operating income 11.5 10.4 9.6
Interest and other income, net 0.3 0.3 0.3
Gain on sale of investment 0.0 0.0 0.4
Earnings before income taxes 11.8 10.7 10.3
Income taxes 4.4 4.1 3.8
Net earnings 7.4% 6.6% 6.5%
(1) Shown as a percentage of related Company-operated retail revenues.
(2) Shown as a percentage of related total specialty revenues.
Consolidated Results of Operations
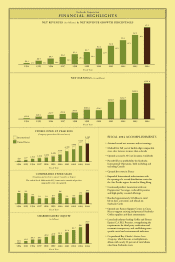
Net revenues for the fi scal year ended 2004 increased 29.9% to
$5.3 billion from $4.1 billion for the 52-week period of fi scal
2003. Net revenues increased 27.3% when calculated on a
comparative 52-week basis for both fi scal 2004 and 2003.
During the fi scal year ended 2004, Starbucks derived 84% of
total net revenues from its Company-operated retail stores.
Company-operated retail revenues increased 29.2% to $4.5
billion for the fi scal year ended 2004, from $3.4 billion for the
52-week period of fi scal 2003. Company-operated retail revenues
increased 26.7% when calculated on a comparative 52-week
basis for both fi scal 2004 and 2003. This increase was primarily
due to the opening of 634 new Company-operated retail stores
during the previous 12 months and comparable store sales growth
of 10%. The increase in comparable store sales was due to
a 9% increase in the number of customer transactions and a
1% increase in the average value per transaction. Comparable
store sales growth percentages were calculated excluding the
extra week of fi scal 2004. Management believes increased
customer traffi c continues to be driven by new product
innovation, continued popularity of core products, a high level of
customer satisfaction and improved speed of service through
enhanced technology, training and execution at retail stores.
The Company derived the remaining 16% of total net revenues
from its Specialty Operations. Specialty revenues, which include
licensing revenues and foodservice and other revenues, increased
33.7% to $837 million for the fi scal year ended 2004, from
$626 million for the 52-week period of fi scal 2003. Excluding
the impact of the extra sales week in fi scal 2004, total specialty
revenues increased 31.0% to $820 million.
Licensing revenues, which are derived from retail store licensing
arrangements, grocery and warehouse club licensing, and certain
other branded-product licensed operations, increased 38.2% to
$566 million for the fi scal year ended 2004, from $410 million
for the 52-week period of fi scal 2003. The increase was due to
higher product sales and royalty revenues from the addition of
710 new licensed retail stores during the previous 12 months
and growth in the grocery and warehouse club businesses. The
growth in the grocery and warehouse club businesses was a result
of expanded agreements with Kraft Foods, Inc., including the
addition of six new Starbucks coffees along with a selection of
Tazo® teas and the acquisition of Seattle Coffee Company in the
fourth quarter of fi scal 2003.
Foodservice and other revenues increased 25.3% to $271
million for the fi scal year ended 2004, from $216 million for
the 52-week period of fi scal 2003. The increase was primarily
attributable to the growth in new and existing foodservice
accounts, which benefi ted from the July 2003 acquisition of
Seattle Coffee Company.
Cost of sales and related occupancy costs increased to 41.5%
of total net revenues in fi scal 2004, from 41.4% in fi scal 2003.
The increase was primarily due to higher dairy and green
coffee commodity costs, partially offset by leverage gained on
occupancy costs, which are primarily fi xed expenses.
Store operating expenses as a percentage of Company-operated
retail revenues increased to 40.2% in fi scal 2004, from 40.0%
in fi scal 2003, primarily due to higher marketing expenditures
for holiday and new product promotions, as well as increased
costs to maintain retail stores and equipment due to sustained
high traffi c levels.
Other operating expenses (expenses associated with the
Company’s Specialty Operations) decreased to 20.5% of
specialty revenues in fi scal 2004, compared to 22.6% in fi scal
2003. The decrease was primarily due to leverage gained on
payroll-related expenditures distributed over an expanded
revenue base.
Depreciation and amortization expenses increased to $280
million in fi scal 2004, from $238 million in fi scal 2003. The
increase was primarily due to a net increase of 634 new
Company-operated retail stores during the previous 12 months
and higher depreciation expenses associated with shortened
estimated useful lives of equipment deployed in the Company’s
foodservice operations. As a percentage of total net revenues,
depreciation and amortization decreased to 5.3% for the 53