Walmart 2012 Annual Report Download - page 19
Download and view the complete annual report
Please find page 19 of the 2012 Walmart annual report below. You can navigate through the pages in the report by either clicking on the pages listed below, or by using the keyword search tool below to find specific information within the annual report.-
 1
1 -
2
-
3
-
4
-
5
-
6
-
7
-
8
-
 9
9 -
 10
10 -
 11
11 -
 12
12 -
 13
13 -
 14
14 -
 15
15 -
 16
16 -
 17
17 -
 18
18 -
 19
19 -
 20
20 -
 21
21 -
 22
22 -
 23
23 -
 24
24 -
 25
25 -
 26
26 -
 27
27 -
 28
28 -
 29
29 -
30
-
31
-
32
-
33
-
34
-
35
-
36
-
37
-
38
-
39
-
40
-
41
-
42
-
43
-
44
-
45
-
46
-
47
-
48
-
49
-
50
-
51
-
52
-
53
-
54
-
55
-
56
-
57
-
58
-
59
-
60
-
61
-
62
 |
 |

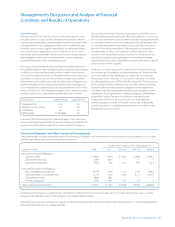
Walmart 2012 Annual Report 1 7
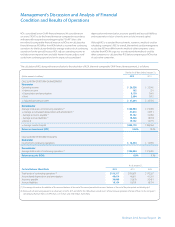
(Dollar amounts in millions, except per share and unit count data)
As of and for the Fiscal Years Ended January 31, 2012 2011 2010 2009 2008
Operating Results
Net sales $443,854 $418,952 $405,132 $401,087 $373,821
Net sales increase 5.9% 3.4% 1.0% 7.3% 8.4%
Increase (decrease) in calendar comparable sales
(1)
in the United States 1.6% (0.6)% (0.8)% 3.5% 1.6%
Walmart U.S. 0.3% (1.5)% (0.7)% 3.2% 1.0%
Sam’s Club 8.4% 3.9% (1.4)% 4.9% 4.9%
Gross profi t margin 24.5% 24.8% 24.9% 24.3% 24.1%
Operating, selling, general and administrative expenses, as
a percentage of net sales 19.2% 19.4% 19.7% 19.4% 19.1%
Operating income $ 26,558 $ 25,542 $ 24,002 $ 22,767 $ 21,916
Income from continuing operations attributable to Walmart 15,766 15,355 14,449 13,235 12,841
Net income per share of common stock:
Diluted net income per common share from
continuing operations attributable to Walmart $ 4.54 $ 4.18 $ 3.73 $ 3.35 $ 3.15
Dividends declared per common share 1.46 1.21 1.09 0.95 0.88
Financial Position
Inventories $ 40,714 $ 36,437 $ 32,713 $ 34,013 $ 34,690
Property, equipment and capital lease assets, net 112,324 107,878 102,307 95,653 96,867
Total assets 193,406 180,782 170,407 163,096 163,200
Long-term debt, including obligations under capital leases 47,079 43,842 36,401 34,549 33,402
Total Walmart shareholders’ equity 71,315 68,542 70,468 64,969 64,311
Unit Counts
Walmart U.S. Segment 3,868 3,804 3,755 3,703 3,595
Walmart International Segment 5,651 4,557 4,099 3,595 3,093
Sam’s Club Segment 611 609 605 611 600
Total units 10,130 8,970 8,459 7,909 7,288
(1) Comparable store and club sales include fuel. Fiscal 2008 comparable sales include all stores and clubs that were open for at least the previous 12 months; however, stores and
clubs that were relocated, expanded or converted are excluded from comparable sales for the rst 12 months following the relocation, expansion or conversion. Fiscal 2012, 2011,
2010 and 2009 comparable sales include sales from stores and clubs open for the previous 12 months, including remodels, relocations and expansions, as well as online sales.
Five-Year Financial Summary