Walmart 2012 Annual Report Download - page 43
Download and view the complete annual report
Please find page 43 of the 2012 Walmart annual report below. You can navigate through the pages in the report by either clicking on the pages listed below, or by using the keyword search tool below to find specific information within the annual report.-
 1
1 -
2
-
3
-
4
-
5
-
6
-
7
-
8
-
9
-
10
-
11
-
12
-
13
-
14
-
15
-
16
-
17
-
18
-
19
-
20
-
21
-
22
-
23
-
24
-
25
-
26
-
27
-
28
-
29
-
30
-
31
-
32
-
 33
33 -
 34
34 -
 35
35 -
 36
36 -
 37
37 -
 38
38 -
 39
39 -
 40
40 -
 41
41 -
 42
42 -
 43
43 -
 44
44 -
 45
45 -
 46
46 -
 47
47 -
 48
48 -
 49
49 -
 50
50 -
 51
51 -
 52
52 -
 53
53 -
54
-
55
-
56
-
57
-
58
-
59
-
60
-
61
-
62
 |
 |

Walmart 2012 Annual Report 4 1
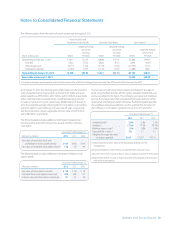
The following table shows the activity for each award type during fi scal 2012:
Restricted Stock and
Performance Share Awards Restricted Stock Rights Stock Options
(1)
Weighted-Average Weighted-Average
Grant-Date Grant-Date Weighted-Average
Fair Value Fair Value Exercise Price
(Shares in thousands) Shares Per Share Shares Per Share Shares Per Share
Outstanding at February 1, 2011 13,617 $52.33 16,838 $47.71 33,386 $49.35
Granted 5,022 55.03 5,826 47.13 2,042 42.90
Vested/exercised (3,177) 51.26 (3,733) 47.26 (13,793) 50.22
Forfeited or expired (2,142) 52.55 (1,310) 47.92 (1,483) 48.01
Outstanding at January 31, 2012 13,320 $53.56 17,621 $47.76 20,152 $48.21
Exercisable at January 31, 2012 13,596 $50.49
(1) Includes stock option awards granted under the Stock Incentive Plan of 2010, the Colleague Share Ownership Plan 1999 and the ASDA Sharesave Plan 2000.
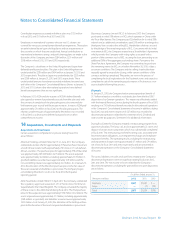
Notes to Consolidated Financial Statements
As of January 31, 2012, the unrecognized compensation cost for restricted
stock and performance share awards, restricted stock rights and stock
option awards was $356 million, $427 million, and $23 million, respectively,
and is expected to be recognized over a weighted-average period of
2.3 years, 2.0 years and 1.0 years, respectively. Additionally, as of January 31,
2012, the weighted-average remaining life for stock options outstanding
and stock options exercisable was 4.3 years and 2.9 years, respectively,
and the stock options had an aggregate intrinsic value of $265 million
and $148 million, respectively.
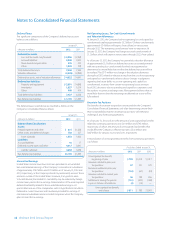
The following table includes additional information related to the
restricted stock and performance share awards and the restricted
stock rights:
Fiscal Years Ended January 31,
(Amounts in millions) 2012 2011 2010
Fair value of restricted stock and
performance share awards vested $134 $142 $110
Fair value of restricted stock rights vested 178 50 49
The following table includes additional information related to stock
option awards:
Fiscal Years Ended January 31,
(Amounts in millions) 2012 2011 2010
Fair value of stock options vested $ 50 $ 54 $ 79
Proceeds from stock options exercised 420 205 111
Intrinsic value of stock options exercised 91 51 39
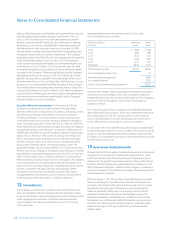
The fair value of each stock option award is estimated on the date of
grant using the Black-Scholes-Merton option valuation model that uses
various assumptions for inputs. The Company uses expected volatilities
and risk-free interest rates that correlate with the expected term of the
option when estimating an option’s fair value. The following table provides
the weighted-average assumptions used to estimate the fair values of
the Company’s stock options granted in fi scal 2012, 2011 and 2010:
Fiscal Years Ended January 31,
2012 2011 2010
Dividend yield
(1)
2.9% 2.3% 2.1%
Volatility
(2)
17.6% 17.1% 18.7%
Risk-free interest rate
(3)
1.3% 1.8% 1.4%
Expected life in years
(4)
3.0 3.1 3.1
Weighted-average fair value
of options granted $9.61 $12.53 $10.41
(1) Expected dividend yield is based on the anticipated dividends over the
vesting period.
(2) Expected volatility is based on historical volatility of the Company’s stock.
(3) Risk-free interest rate is based on the U.S. Treasury yield curve at the time of the grant.
(4) Expected life in years is based on historical exercise and expiration activity of grants
with similar vesting periods.