Walmart 2012 Annual Report Download - page 21
Download and view the complete annual report
Please find page 21 of the 2012 Walmart annual report below. You can navigate through the pages in the report by either clicking on the pages listed below, or by using the keyword search tool below to find specific information within the annual report.-
 1
1 -
2
-
3
-
4
-
5
-
6
-
7
-
8
-
9
-
10
-
 11
11 -
 12
12 -
 13
13 -
 14
14 -
 15
15 -
 16
16 -
 17
17 -
 18
18 -
 19
19 -
 20
20 -
 21
21 -
 22
22 -
 23
23 -
 24
24 -
 25
25 -
 26
26 -
 27
27 -
 28
28 -
 29
29 -
 30
30 -
 31
31 -
32
-
33
-
34
-
35
-
36
-
37
-
38
-
39
-
40
-
41
-
42
-
43
-
44
-
45
-
46
-
47
-
48
-
49
-
50
-
51
-
52
-
53
-
54
-
55
-
56
-
57
-
58
-
59
-
60
-
61
-
62
 |
 |

Management’s Discussion and Analysis of Financial
Condition and Results of Operations
Walmart 2012 Annual Report 1 9
We compete with a number of companies for prime retail site locations,
as well as in attracting and retaining quality employees (whom we call
“associates”). We, along with other retail companies, are infl uenced by a
number of factors including, but not limited to: general economic condi-
tions, cost of goods, consumer disposable income, consumer debt levels
and buying patterns, consumer credit availability, interest rates, customer
preferences, unemployment, labor costs, infl ation, defl ation, currency
exchange fl uctuations, fuel and energy prices, weather patterns, climate
change, catastrophic events, competitive pressures and insurance costs.
Further information on certain risks to our Company can be located in
“Item 1A. Risk Factors” in our Annual Report on Form 10-K for the fi scal
year ended January 31, 2012.
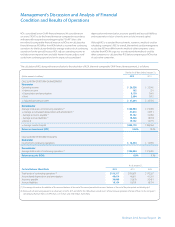
Company Performance Metrics
The Company’s performance metrics emphasize three priorities for
improving shareholder value: growth, leverage and returns. The
Company’s priority of growth focuses on sales through comparable store
and club sales and unit square feet growth; the priority of leverage
encompasses the Company’s objective to increase its operating income
at a faster rate than the growth in net sales by growing its operating,
selling, general and administrative expenses (“operating expenses”) at a
slower rate than the growth of its net sales; and the priority of returns
focuses on how effi ciently the Company employs its assets through
return on investment (“ROI”) and how eff ectively the Company manages
working capital through free cash fl ow.
Growth
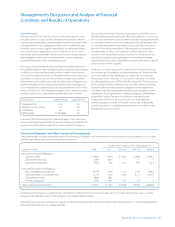
Net Sales
Fiscal Years Ended January 31,
(Dollar amounts in millions) 2012 2011 2010
Percent Percent Percent Percent Percent
Net Sales of Total Change Net Sales of Total Change Net Sales of Total
Walmart U.S. $264,186 59.5% 1.5% $260,261 62.1% 0.1% $259,919 64.2%
Walmart International 125,873 28.4% 15.2% 109,232 26.1% 12.1% 97,407 24.0%
Sam’s Club 53,795 12.1% 8.8% 49,459 11.8% 3.5% 47,806 11.8%
Net Sales $443,854 100.0% 5.9% $418,952 100.0% 3.4% $405,132 100.0%
Calendar Comparable Store and Club Sales
Comparable store and club sales is a measure which indicates the performance of our existing U.S. stores and clubs by measuring the growth in
sales for such stores and clubs for a particular period over the corresponding period in the previous fi scal year. The retail industry generally reports
comparable store and club sales using the retail calendar (also known as the 4-5-4 calendar) and, to be consistent with the retail industry, we provide
comparable store and club sales using the retail calendar in our quarterly earnings releases. However, when we discuss our comparable store and
club sales below, we are referring to our calendar comparable store and club sales calculated using our fi scal calendar. As our fi scal calendar diff ers
from the retail calendar, our calendar comparable store and club sales also diff er from the retail calendar comparable store and club sales provided in
our quarterly earnings releases. Calendar comparable store and club sales for fi scal 2012, 2011 and 2010 are as follows:
With Fuel Fuel Impact
Fiscal Years Ended January 31, Fiscal Years Ended January 31,
2012 2011 2010 2012 2011 2010
Walmart U.S. 0.3% -1.5% -0.7% 0.0% 0.0% 0.0%
Sam’s Club 8.4% 3.9% -1.4% 3.4% 2.0% -2.1%
Total U.S. 1.6% -0.6% -0.8% 0.6% 0.4% -0.3%
Our consolidated net sales increased 5.9% and 3.4% in fi scal 2012 and 2011,
respectively, compared to the previous fi scal year. The increase in net sales
for fi scal 2012 was attributable to a combination of an increase in compa-
rable sales, growth in retail square feet and currency translation benefi ts,
while the increase in net sales for fi scal 2011 was attributable to growth in
retail square feet and currency translation benefi ts, partially off set by a
decline in comparable store and club sales. Acquisitions also contributed to
the increase in net sales for fi scal 2012. Our continued expansion activities
added 5.3% and 3.4% of additional retail square feet during fi scal 2012 and
2011, respectively. Currency translation benefi ts accounted for $4.0 billion
and $4.5 billion of the increase in net sales for fi scal 2012 and 2011, respec-
tively. The acquisitions of Netto and Massmart completed in the second
quarter of fi scal 2012, and further discussed in Note 14 in the “Notes to
Consolidated Financial Statements,” accounted for $4.7 billion of the net
sales increase in fi scal 2012. Volatility in currency exchange rates may
continue to impact the Company’s net sales in the future.