Walmart 2012 Annual Report Download - page 60
Download and view the complete annual report
Please find page 60 of the 2012 Walmart annual report below. You can navigate through the pages in the report by either clicking on the pages listed below, or by using the keyword search tool below to find specific information within the annual report.-
 1
1 -
2
-
3
-
4
-
5
-
6
-
7
-
8
-
9
-
10
-
11
-
12
-
13
-
14
-
15
-
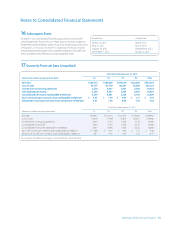
16
-
17
-
18
-
19
-
20
-
21
-
22
-
23
-
24
-
25
-
26
-
27
-
28
-
29
-
30
-
31
-
32
-
33
-
34
-
35
-
36
-
37
-
38
-
39
-
40
-
41
-
42
-
43
-
44
-
45
-
46
-
47
-
48
-
49
-
 50
50 -
 51
51 -
 52
52 -
 53
53 -
 54
54 -
 55
55 -
 56
56 -
 57
57 -
 58
58 -
 59
59 -
 60
60 -
 61
61 -
 62
62
 |
 |
58 Walmart 2012 Annual Report
Designed and produced by Corporate Reports Inc./Atlanta www.corporatereport.com
Corporate and Stock Information
Corporate Information
Stock Registrar and Transfer Agent:
Computershare Trust Company, N.A.
P.O. Box 43069
Providence, Rhode Island 02940-3069 USA
1-800-438-6278
TDD for hearing-impaired inside the U.S. 1-800-952-9245
Internet: http//www.computershare.com
Listing
New York Stock Exchange
Stock Symbol: WMT
Annual Meeting
Our Annual Meeting of Shareholders will be held on Friday, June 1, 2012,
at 7:00 a.m. (Central time) in Bud Walton Arena on the University of Arkansas
campus, Fayetteville, Arkansas.
Communication With Shareholders
Wal-Mart Stores, Inc. periodically communicates with shareholders
and other members of the investment community about our operations.
For further information regarding our policy on shareholder and investor
communications, refer to our website, www.walmartstores.com/investors.
The following reports are available without charge upon request by writing
the Company c/o Investor Relations or by calling 1-479-273-8446. These
reports are also available via the corporate website.
• Annual Report on Form 10-K
• Quarterly Reports on Form 10-Q
• Earnings Releases
• Current Reports on Form 8-K
• Copy of Annual Shareholders’ Meeting Proxy Statement
• Global Responsibility Report
• Diversity and Inclusion Report
• Workforce Diversity Report
Independent Registered Public Accounting Firm
Ernst & Young LLP
5414 Pinnacle Point Dr., Suite 102
Rogers, Arkansas 72758 USA
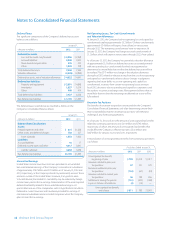
Market Price of Common Stock
The high and low market price per share for the Company’s common stock
in fi scal 2012 and 2011 were as follows:
2012 2011
High Low High Low
1st Quarter $56.73 $50.97 $56.27 $52.66
2nd Quarter 56.47 51.79 54.95 47.77
3rd Quarter 57.96 48.31 54.82 50.00
4th Quarter 62.00 55.68 57.90 53.14
The high and low market price per share for the Company’s common stock
for the fi rst quarter of fi scal 2013, were as follows:
2013
High Low
1st Quarter* $62.63 $58.21
*Through March 22, 2012
Dividends Payable Per Share
For fi scal 2013, dividends will be paid based on the following schedule:
April 4, 2012 $0.3975
June 4, 2012 $0.3975
September 4, 2012 $0.3975
January 2, 2013 $0.3975
Dividends Paid Per Share
For fi scal 2012, dividends were paid on the following schedule:
April 4, 2011 $0.3650
June 6, 2011 $0.3650
September 6, 2011 $0.3650
January 3, 2012 $0.3650
For fi scal 2011, dividends were paid on the following schedule:
April 5, 2010 $0.3025
June 1, 2010 $0.3025
September 7, 2010 $0.3025
January 3, 2011 $0.3025
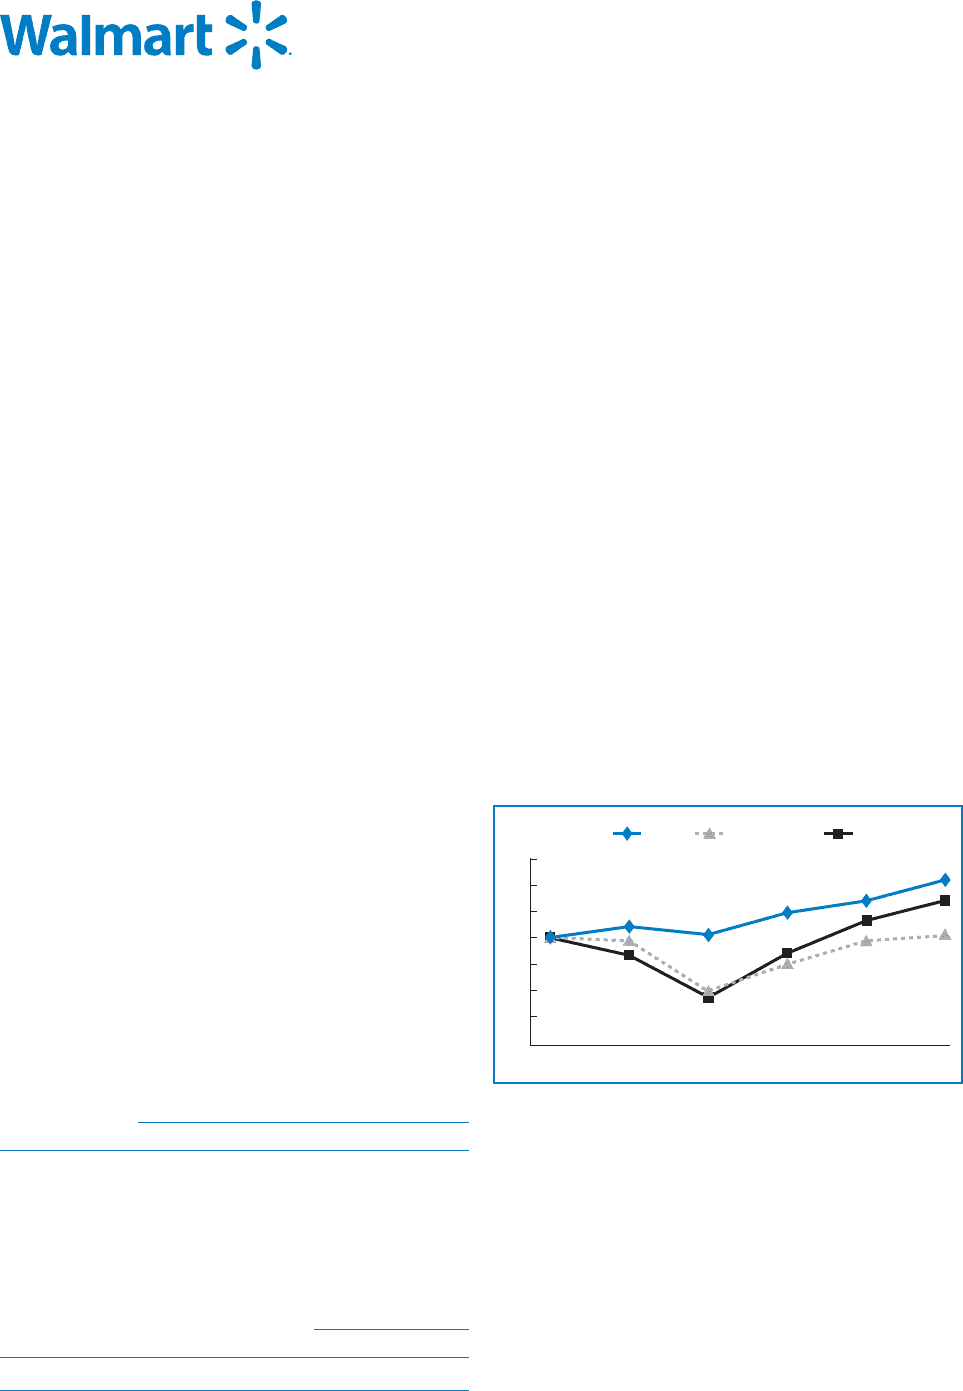
Stock Performance Chart
This graph compares the cumulative total shareholder return on Walmart’s
common stock during the fi ve fi scal years ending with fi scal 2012 to the
cumulative total returns on the S&P 500 Retailing Index and the S&P 500
Index. The comparison assumes $100 was invested on February 1, 2007, in
shares of our common stock and in each of the indices shown and assumes
that all of the dividends were reinvested.
Comparison of 5-Year Cumulative Total Return
Among Wal-Mart Stores, Inc., the S&P 500 Index and S&P 500 Retailing Index
$160
$140
$120
$100
$ 80
$ 60
$ 40
$ 20
20122007 2008 2009 20112010
S&P 500 Retailing IndexS&P 500 IndexWMT
Fiscal Years
Assumes $100 Invested on February 1, 2007
Assumes Dividends Reinvested
Fiscal Year Ending January 31, 2012
Shareholders
As of March 22, 2012, there were 275,525 holders of record of Walmart’s
common stock.