Walmart 2012 Annual Report Download - page 27
Download and view the complete annual report
Please find page 27 of the 2012 Walmart annual report below. You can navigate through the pages in the report by either clicking on the pages listed below, or by using the keyword search tool below to find specific information within the annual report.-
 1
1 -
2
-
3
-
4
-
5
-
6
-
7
-
8
-
9
-
10
-
11
-
12
-
13
-
14
-
15
-
16
-
 17
17 -
 18
18 -
 19
19 -
 20
20 -
 21
21 -
 22
22 -
 23
23 -
 24
24 -
 25
25 -
 26
26 -
 27
27 -
 28
28 -
 29
29 -
 30
30 -
 31
31 -
 32
32 -
 33
33 -
 34
34 -
 35
35 -
 36
36 -
 37
37 -
38
-
39
-
40
-
41
-
42
-
43
-
44
-
45
-
46
-
47
-
48
-
49
-
50
-
51
-
52
-
53
-
54
-
55
-
56
-
57
-
58
-
59
-
60
-
61
-
62
 |
 |

Management’s Discussion and Analysis of Financial
Condition and Results of Operations
Walmart 2012 Annual Report 2 5
Net sales for the Sam’s Club segment increased 8.8% and 3.5% for fi scal
2012 and 2011, respectively, compared to the previous fi scal year. The net
sales increase in fi scal 2012 compared to fi scal 2011 was primarily due to
positive comparable club sales, driven by customer traffi c, increases in
average ticket and higher fuel sales. Higher fuel sales, resulting from higher
fuel prices and increased gallons sold, positively impacted comparable
sales by 340 basis points during fi scal 2012. The fi scal 2011 growth in net
sales is primarily due to the increase in average ticket and member traffi c.
In addition, fuel sales, driven by higher fuel prices and gallons sold, posi-
tively impacted comparable club sales by 200 basis points in fi scal 2011.
Volatility in fuel prices may continue to impact the net sales and operating
income of the Sam’s Club segment in the future.
Gross profi t margin decreased 41 basis points for fi scal 2012 compared
to fi scal 2011. The gross profi t margin decrease was driven by the highly
competitive retail environment, as well as infl ation and high fuel costs.
Fuel costs negatively impacted the comparison by 33 basis points for
fi scal 2012. Gross profi t margin was relatively fl at for fi scal 2011 compared
to fi scal 2010.
Operating expenses, as a percentage of net sales, decreased 55 basis
points and 48 basis points in fi scal 2012 and 2011, respectively, compared
to the previous fi scal year. Fuel, which positively impacted the comparison
by 31 and 19 basis points for fi scal 2012 and 2011, respectively, and
improved wage management were the primary drivers of the basis point
reduction in operating expenses as a percentage of segment net sales
for both fi scal years.
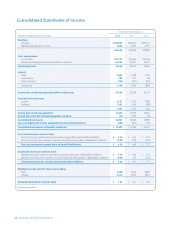
As a result of the factors discussed above, operating income
was $1.9 billion, $1.7 billion and $1.5 billion for fi scal 2012, 2011 and
2010, respectively.
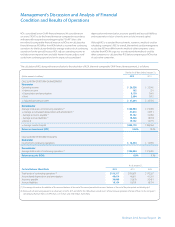
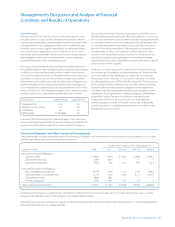
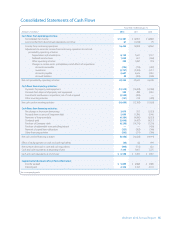
Liquidity and Capital Resources
Cash fl ows provided by operating activities have historically supplied
us with a signifi cant source of liquidity. We use these cash fl ows, supple-
mented with long-term debt and short-term borrowings, to fund our
operations and global expansion activities. Generally, some or all of the
remaining free cash fl ow, if any, funds all or part of the dividends on our
common stock and share repurchases.
Fiscal Years Ended January 31,
(Amounts in millions) 2012 2011 2010
Net cash provided by
operating activities $ 24,255 $ 23, 643 $ 26,249
Payments for property
and equipment (13,510) (12,699) (12,184)
Free cash fl ow $ 10,745 $ 10,944 $ 14,065
Net cash used in
investing activities
(1)
$(16,609) $(12,193) $(11,620)
Net cash used in
fi nancing activities $ (8,458) $(12,028) $(14,191)
(1) “Net cash used in investing activities” includes payments for property and
equipment, which is also included in our computation of free cash ow.
Cash Flows from Operating Activities
Cash fl ows provided by operating activities were $24.3 billion, $23.6 billion
and $26.2 billion for fi scal 2012, 2011 and 2010, respectively. The increase
in operating cash fl ow in fi scal 2012 compared to fi scal 2011 was primarily
the result of additional income from continuing operations and the
timing of payments for accrued liabilities. The decrease in cash fl ow from
operating activities during fi scal 2011 was primarily due to an increased
investment in inventory after fi scal 2010 ended with relatively low inventory
levels, partially off set by increases in accounts payable.
Cash Equivalents and Working Capital
Cash and cash equivalents were $6.6 billion and $7.4 billion at January 31,
2012 and 2011, respectively, of which $5.6 billion and $7.1 billion, respectively,
were held outside of the U.S. and are generally utilized to support liquidity
needs in our foreign operations. Our working capital defi cits were $7.3 billion
and $6.6 billion at January 31, 2012 and 2011, respectively. We generally
operate with a working capital defi cit due to our effi cient use of cash in
funding operations and in providing returns to our shareholders in the
form of stock repurchases and the payment of dividends.
We employ fi nancing strategies in an eff ort to ensure that cash can be
made available in the country in which it is needed with the minimum
cost possible. We do not believe it will be necessary to repatriate cash and
cash equivalents held outside of the U.S. and anticipate our domestic
liquidity needs will be met through other funding sources (ongoing
cash fl ows generated from operations, external borrowings, or both).
Accordingly, we intend, with only certain limited exceptions, to continue
to permanently reinvest the cash in our foreign operations. Were our
intention to change, most of the amounts held within our foreign
operations could be repatriated to the U.S., although any repatriations
under current U.S. tax laws would be subject to U.S. federal income taxes,
less applicable foreign tax credits. As of January 31, 2012 and 2011,
approximately $768 million and $691 million, respectively, may not be
freely transferable to the U.S. due to local laws or other restrictions.
We do not expect local laws, other limitations or potential taxes on
anticipated future repatriations of amounts held outside of the United
States to have a material eff ect on our overall liquidity, fi nancial condition
or results of operations.
Cash Flows from Investing Activities
Cash fl ows from investing activities generally consist of payments for
property and equipment, which were $13.5 billion, $12.7 billion and
$12.2 billion during fi scal 2012, 2011 and 2010, respectively. These capital
expenditures primarily relate to new store growth, as well as remodeling
costs for existing stores and our investments in Global eCommerce.
Additionally, in fi scal 2012, we made additional investments of $3.5 billion,
net of cash acquired, for the acquisitions of Netto and Massmart, further
discussed in Note 14 in “Notes to Consolidated Financial Statements,” in
addition to other immaterial acquisitions. We expect capital expenditures
for property and equipment in fi scal 2013, excluding any business
acquisitions, to range between $13.0 billion and $14.0 billion.