Walmart 2012 Annual Report Download - page 49
Download and view the complete annual report
Please find page 49 of the 2012 Walmart annual report below. You can navigate through the pages in the report by either clicking on the pages listed below, or by using the keyword search tool below to find specific information within the annual report.-
 1
1 -
2
-
3
-
4
-
5
-
6
-
7
-
8
-
9
-
10
-
11
-
12
-
13
-
14
-
15
-
16
-
17
-
18
-
19
-
20
-
21
-
22
-
23
-
24
-
25
-
26
-
27
-
28
-
29
-
30
-
31
-
32
-
33
-
34
-
35
-
36
-
37
-
38
-
 39
39 -
 40
40 -
 41
41 -
 42
42 -
 43
43 -
 44
44 -
 45
45 -
 46
46 -
 47
47 -
 48
48 -
 49
49 -
 50
50 -
 51
51 -
 52
52 -
 53
53 -
 54
54 -
 55
55 -
 56
56 -
 57
57 -
 58
58 -
 59
59 -
60
-
61
-
62
 |
 |

Walmart 2012 Annual Report 4 7
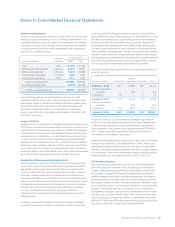
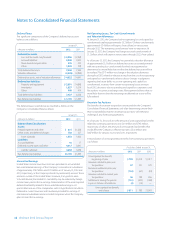
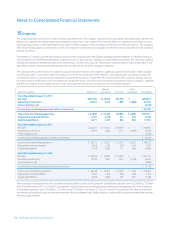
Financial Statement Presentation
Hedging instruments with an unrealized gain are recorded in the Company’s Consolidated Balance Sheets as either a current or a non-current asset, based
on maturity date, and those hedging instruments with an unrealized loss are recorded as either a current or a non-current liability, based on maturity date.
As of January 31, 2012 and 2011, the Company’s fi nancial instruments were classifi ed as follows in its Consolidated Balance Sheets:
January 31, 2012 January 31, 2011
Fair Value Net Investment Cash Flow Fair Value Net Investment Cash Flow
(Amounts in millions) Instruments Hedge Instruments Instruments Hedge Instruments
Balance Sheet Classi cation:
Prepaid expenses and other $ 2 $ — $ — $ — $ — $ —
Other assets and deferred charges 181 316 91 267 233 238
Assets subtotals $183 $316 $ 91 $267 $233 $238
Long-term debt due within one year $ 2 $ — $ — $ — $ — $ —
Long-term debt 181 — — 267 — —
Deferred income taxes and other — — 110 — — 18
Liability subtotals $183 $ — $110 $267 $ — $ 18
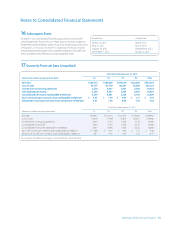
Notes to Consolidated Financial Statements
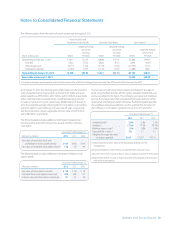
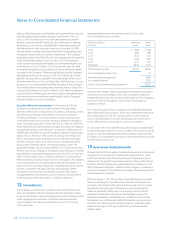
10 Taxes
Income from Continuing Operations
The components of income from continuing operations before income
taxes are as follows:
Fiscal Years Ended January 31,
(Amounts in millions) 2012 2011 2010
U.S. $18,685 $18,398 $17,705
Non-U.S. 5,713 5,140 4,413
Total income from continuing
operations before income taxes $24,398 $23,538 $22,118
A summary of the provision for income taxes is as follows:
Fiscal Years Ended January 31,
(Amounts in millions) 2012 2011 2010
Current:
U.S. federal $4,596 $4,600 $5,798
U.S. state and local 743 637 599
International 1,403 1,466 1,246
Total current tax provision 6,742 6,703 7,643
Deferred:
U.S. federal 1,444 818 (432)
U.S. state and local 57 39 78
International (299) 19 (133)
Total deferred tax provision 1,202 876 (487)
Total provision for income taxes $7,944 $7,579 $7,156
E ective Tax Rate Reconciliation
The Company’s eff ective income tax rate is typically lower than the
U.S. statutory rate primarily because of benefi ts from lower-taxed global
operations, including the use of global funding structures and certain
U.S. tax credits. The Company’s non-U.S. income is subject to local
country tax rates that are below the 35% U.S. statutory rate. Certain non-
U.S. earnings have been indefi nitely reinvested outside the U.S. and are
not subject to current U.S. income tax. A reconciliation of the signifi cant
diff erences between the U.S. statutory tax rate and the eff ective income
tax rate on pretax income from continuing operations is as follows:
Fiscal Years Ended January 31,
2012 2011 2010
U.S. statutory tax rate 35.0% 35.0% 35.0%
U.S. state income taxes, net of
federal income tax benefi t 2.0% 1.9% 2.0%
Income taxed outside the U.S. -2.8% -2.2% -1.6%
Net impact of repatriated
international earnings -0.3% -1.5% -3.4%
Other, net -1.3% -1.0% 0.4%
Eff ective income tax rate 32.6% 32.2% 32.4%