Walmart 2012 Annual Report Download - page 23
Download and view the complete annual report
Please find page 23 of the 2012 Walmart annual report below. You can navigate through the pages in the report by either clicking on the pages listed below, or by using the keyword search tool below to find specific information within the annual report.-
 1
1 -
2
-
3
-
4
-
5
-
6
-
7
-
8
-
9
-
10
-
11
-
12
-
 13
13 -
 14
14 -
 15
15 -
 16
16 -
 17
17 -
 18
18 -
 19
19 -
 20
20 -
 21
21 -
 22
22 -
 23
23 -
 24
24 -
 25
25 -
 26
26 -
 27
27 -
 28
28 -
 29
29 -
 30
30 -
 31
31 -
 32
32 -
 33
33 -
34
-
35
-
36
-
37
-
38
-
39
-
40
-
41
-
42
-
43
-
44
-
45
-
46
-
47
-
48
-
49
-
50
-
51
-
52
-
53
-
54
-
55
-
56
-
57
-
58
-
59
-
60
-
61
-
62
 |
 |

Management’s Discussion and Analysis of Financial
Condition and Results of Operations
Walmart 2012 Annual Report 2 1
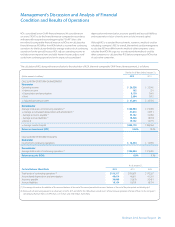
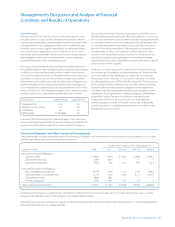
The calculation of ROI, along with a reconciliation to the calculation of ROA, the most comparable GAAP fi nancial measurement, is as follows:
For the Fiscal Years Ended January 31,
(Dollar amounts in millions) 2012 2011
CALCULATION OF RETURN ON INVESTMENT
Numerator
Operating income $ 26,558 $ 25,542
+ Interest income 162 201
+ Depreciation and amortization 8,130 7,641
+ Rent 2,394 1,972
= Adjusted operating income $ 37,244 $ 35,356
Denominator
Average total assets of continuing operations
(1)
$186,984 $175,459
+ Average accumulated depreciation and amortization
(1)
47,613 43,911
- Average accounts payable
(1)
35,142 32,064
- Average accrued liabilities
(1)
18,428 18,718
+ Rent x 8 19,152 15,776
= Average invested capital $200,179 $184,364
Return on investment (ROI) 18.6% 19.2%
CALCULATION OF RETURN ON ASSETS
Numerator
Income from continuing operations $ 16,454 $ 15,959
Denominator
Average total assets of continuing operations
(1)
$186,984 $175,459
Return on assets (ROA) 8.8% 9.1%
As of January 31,
Certain Balance Sheet Data 2012 2011 2010
Total assets of continuing operations
(2)
$193,317 $180,651 $170,267
Accumulated depreciation and amortization 48,614 46,611 41,210
Accounts payable 36,608 33,676 30,451
Accrued liabilities 18,154 18,701 18,734
(1) The average is based on the addition of the account balance at the end of the current period to the account balance at the end of the prior period and dividing by 2.
(2) Total assets of continuing operations as of January 31, 2012, 2011 and 2010 in the table above exclude assets of discontinued operations that are re ected in the Company’s
Consolidated Balance Sheets of $89 million, $131 million and $140 million, respectively.
ROI is considered a non-GAAP fi nancial measure. We consider return
on assets (“ROA”) to be the fi nancial measure computed in accordance
with generally accepted accounting principles (“GAAP”) that is the
most directly comparable fi nancial measure to ROI as we calculate that
fi nancial measure. ROI diff ers from ROA (which is income from continuing
operations for the fi scal year divided by average total assets of continuing
operations for the period) because ROI: adjusts operating income to
exclude certain expense items and adds interest income; adjusts total
assets from continuing operations for the impact of accumulated
depreciation and amortization, accounts payable and accrued liabilities;
and incorporates a factor of rent to arrive at total invested capital.
Although ROI is a standard fi nancial metric, numerous methods exist for
calculating a company’s ROI. As a result, the method used by management
to calculate ROI may diff er from the methods other companies use to
calculate their ROI. We urge you to understand the methods used by
other companies to calculate their ROI before comparing our ROI to that
of such other companies.