Walmart 2012 Annual Report Download - page 22
Download and view the complete annual report
Please find page 22 of the 2012 Walmart annual report below. You can navigate through the pages in the report by either clicking on the pages listed below, or by using the keyword search tool below to find specific information within the annual report.-
 1
1 -
2
-
3
-
4
-
5
-
6
-
7
-
8
-
9
-
10
-
11
-
 12
12 -
 13
13 -
 14
14 -
 15
15 -
 16
16 -
 17
17 -
 18
18 -
 19
19 -
 20
20 -
 21
21 -
 22
22 -
 23
23 -
 24
24 -
 25
25 -
 26
26 -
 27
27 -
 28
28 -
 29
29 -
 30
30 -
 31
31 -
 32
32 -
33
-
34
-
35
-
36
-
37
-
38
-
39
-
40
-
41
-
42
-
43
-
44
-
45
-
46
-
47
-
48
-
49
-
50
-
51
-
52
-
53
-
54
-
55
-
56
-
57
-
58
-
59
-
60
-
61
-
62
 |
 |

Management’s Discussion and Analysis of Financial
Condition and Results of Operations
20 Walmart 2012 Annual Report
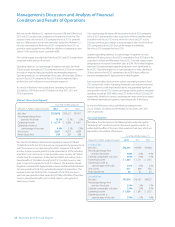
Comparable store and club sales in the U.S., including fuel, increased 1.6% in fi scal 2012 and decreased 0.6% and 0.8% in fi scal 2011 and 2010,
respectively. U.S. comparable store sales increased during fi scal 2012 primarily due to an increase in average ticket, partially off set by a decline in traffi c.
Comparable club sales were higher during fi scal 2012 due to a larger member base driving increased traffi c, as well as a broader assortment of items.
Total U.S. comparable store and club sales decreased during fi scal 2011 primarily due to a decline in customer traffi c. Although customer traffi c
increased in fi scal 2010, comparable store and club sales in the U.S. were lower than those in the previous fi scal year due to defl ation in certain
merchandise categories and lower fuel prices.
As we continue to add new stores and clubs in the U.S., we do so with an understanding that additional stores and clubs may take sales away from
existing units. We estimate the negative impact on comparable store and club sales as a result of opening new stores and clubs was approximately
0.8% in fi scal 2012 and 2011 and 0.6% in fi scal 2010.
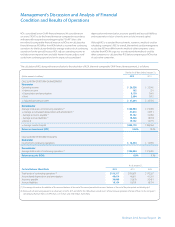
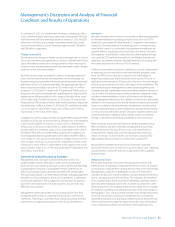
Leverage
Operating Income
Fiscal Years Ended January 31,
(Dollar amounts in millions)
2012 2011 2010
Operating Percent Percent Operating Percent Percent Operating Percent
Income of Total Change Income of Total Change Income of Total
Walmart U.S. $20,367 76.7% 2.2% $19,919 78.0% 3.1% $19,314 80.5%
Walmart International 6,214 23.4% 10.8% 5,606 21.9% 14.4% 4,901 20.4%
Sam’s Club 1,865 7.0% 9.0% 1,711 6.7% 12.9% 1,515 6.3%
Other unallocated (1,888) -7.1% 11.5% (1,694) -6.6% -2.0% (1,728) -7.2%
Total operating income $26,558 100.0% 4.0% $25,542 100.0% 6.4% $24,002 100.0%
We believe comparing the growth of our operating expenses to the
growth of our net sales and comparing the growth of our operating
income to the growth of our net sales are meaningful measures as they
indicate how eff ectively we manage costs and leverage operating
expenses. Our objective is to grow operating expenses at a slower rate
than net sales and to grow operating income at a faster rate than net sales.
On occasion, we may make strategic growth investments that may, at
times, cause our operating expenses to grow at a rate faster than net sales
and that may grow our operating income at a slower rate than net sales.
Operating Expenses
We leveraged operating expenses in fi scal 2012 and 2011. In fi scal 2012,
our operating expenses increased 4.8% compared to fi scal 2011, while
net sales increased 5.9% in fi scal 2012 compared to fi scal 2011. Operating
expenses grew at a slower rate than net sales due to our continued focus
on expense management. Our Global eCommerce initiatives contributed
to the majority of the increase in operating expenses, as we continue
to invest in our e-commerce platforms. Depreciation expense increased
year-over-year based on our fi nancial system investments with the
remainder of the increase being driven by multiple items, none of which
were individually signifi cant. In fi scal 2011, our operating expenses
increased 1.7% compared to fi scal 2010, while net sales increased 3.4%
during fi scal 2011 compared to fi scal 2010. Operating expenses grew at a
slower rate than net sales in fi scal 2011 due to improved labor productivity
and organizational changes made at the end of fi scal 2010 designed to
strengthen and streamline our operations, as well as a reduction in certain
incentive plan expenses.
Operating Income
As a result of the factors discussed above and our investment in price
for products sold in our retail operations, which reduced our gross
margin, our operating income increased 4.0% and 6.4% in fi scal 2012
and 2011, respectively, while net sales increased 5.9% and 3.4% in fi scal
2012 and 2011, respectively.
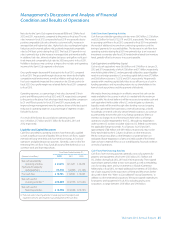
Returns
Return on Investment
Management believes return on investment (“ROI”) is a meaningful metric
to share with investors because it helps investors assess how eff ectively
Walmart is deploying its assets. Trends in ROI can fl uctuate over time as
management balances long-term potential strategic initiatives with any
possible short-term impacts. ROI was 18.6% and 19.2% for fi scal 2012 and
2011, respectively. The decrease in ROI in fi scal 2012 from fi scal 2011 was
due primarily to additional investments in property, plant and equipment,
Global eCommerce and higher inventories, as well as price investment
ahead of full realization of productivity improvements. In future periods,
productivity gains are expected to align more closely with price invest-
ments. Additionally, to a lesser degree, ROI was positively impacted by
currency translation fl uctuations, but off set by acquisitions.
We defi ne ROI as adjusted operating income (operating income plus
interest income, depreciation and amortization, and rent expense) for
the fi scal year divided by average invested capital during that period.
We consider average invested capital to be the average of our beginning
and ending total assets of continuing operations, plus average accumulated
depreciation and average amortization, less average accounts payable
and average accrued liabilities for that period, plus a rent factor equal to
the rent for the fi scal year multiplied by a factor of eight.