Walmart 2012 Annual Report Download - page 25
Download and view the complete annual report
Please find page 25 of the 2012 Walmart annual report below. You can navigate through the pages in the report by either clicking on the pages listed below, or by using the keyword search tool below to find specific information within the annual report.-
 1
1 -
2
-
3
-
4
-
5
-
6
-
7
-
8
-
9
-
10
-
11
-
12
-
13
-
14
-
 15
15 -
 16
16 -
 17
17 -
 18
18 -
 19
19 -
 20
20 -
 21
21 -
 22
22 -
 23
23 -
 24
24 -
 25
25 -
 26
26 -
 27
27 -
 28
28 -
 29
29 -
 30
30 -
 31
31 -
 32
32 -
 33
33 -
 34
34 -
 35
35 -
36
-
37
-
38
-
39
-
40
-
41
-
42
-
43
-
44
-
45
-
46
-
47
-
48
-
49
-
50
-
51
-
52
-
53
-
54
-
55
-
56
-
57
-
58
-
59
-
60
-
61
-
62
 |
 |

Management’s Discussion and Analysis of Financial
Condition and Results of Operations
Walmart 2012 Annual Report 2 3
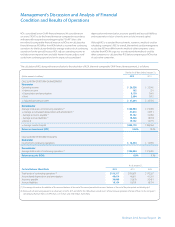
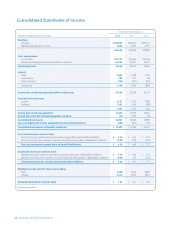
Our consolidated net sales increased 5.9% and 3.4% in fi scal 2012 and
2011, respectively, compared to the previous fi scal year. The increase in
net sales for fi scal 2012 was attributable to a combination of an increase
in comparable sales, growth in retail square feet and currency translation
benefi ts, while the increase in net sales for fi scal 2011 was attributable to
growth in retail square feet and currency translation benefi ts, partially
off set by a decline in comparable store and club sales. Acquisitions also
contributed to the increase in net sales for fi scal 2012. Our continued
expansion activities, including acquisitions, added 5.3% and 3.4% of
additional retail square feet during fi scal 2012 and 2011, respectively.
Currency translation benefi ts accounted for $4.0 billion and $4.5 billion
of the increase in net sales for fi scal 2012 and 2011, respectively. The
acquisitions of Netto and Massmart completed in the second quarter of
fi scal 2012, and further discussed in Note 14 in the “Notes to Consolidated
Financial Statements,” accounted for $4.7 billion of the net sales increase
in fi scal 2012. Volatility in currency exchange rates may continue to
impact the Company’s net sales in the future.
Our gross profi t, as a percentage of net sales (“gross profi t margin”),
declined 33 and 11 basis points in fi scal 2012 and 2011, respectively,
compared to the previous fi scal year. All three segments realized a
decline in gross profi t margin during fi scal 2012 based on our investment
in price. Our Walmart U.S. segment and Walmart International segment
net sales yield higher gross profi t margins than our Sam’s Club segment,
which operates on lower margins as a membership club warehouse. In
fi scal 2011, gross profi t margin was relatively fl at compared to fi scal 2010.
Operating expenses, as a percentage of net sales, were 19.2%, 19.4% and
19.7% for fi scal 2012, 2011 and 2010, respectively. In fi scal 2012, operating
expenses as a percentage of net sales decreased primarily due to our
focus on expense management. In fi scal 2011, operating expenses as a
percentage of net sales decreased primarily due to improved labor
productivity and organizational changes implemented at the end of
fi scal 2010 designed to strengthen and streamline our operations, as well
as a reduction in certain incentive plan expenses.
Operating income was $26.6 billion, $25.5 billion and $24.0 billion for
fi scal 2012, 2011 and 2010, respectively. Eff ects of currency exchange
fl uctuations positively impacted operating income in fi scal 2012 and
2011 by $105 million and $231 million, respectively. Volatility in currency
exchange rates may continue to impact the Company’s operating
income in the future.
Our eff ective income tax rate on consolidated income from continuing
operations was 32.6% in fi scal 2012 compared with 32.2% and 32.4% in
fi scal 2011 and 2010, respectively. The eff ective income tax rate for fi scal
2012 remained largely consistent with the rates for fi scal 2011 and 2010
primarily as a result of net favorability in various items during fi scal 2012.
The eff ective income tax rate for fi scal 2011 was consistent with that for
fi scal 2010 due to recognizing certain net tax benefi ts totaling $434 million
and $372 million in fi scal 2011 and 2010, respectively, stemming primarily
from the decision to repatriate certain non-U.S.
earnings that increased
the Company’s U.S. foreign tax credits and favorable adjustments to
transfer pricing agreements. The reconciliation from the U.S. statutory
rate to the eff ective tax rates for fi scal 2012, 2011 and 2010 is presented in
Note 10 in the “Notes to Consolidated Financial Statements.” We expect
the fiscal 2013 annual effective tax rate to be approximately 32.5%
to 33.5%. Signifi cant factors that may impact the annual eff ective tax
rate include changes in our assessment of certain tax contingencies,
valuation allowances, changes in law, outcomes of administrative audits,
the impact of discrete items and the mix of earnings among our U.S. and
international operations.
As a result of the factors discussed above, we reported $16.5 billion,
$16.0 billion and $15.0 billion of income from continuing operations for
fi scal 2012, 2011 and 2010, respectively.
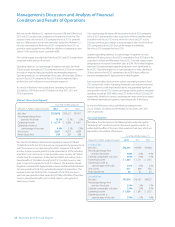
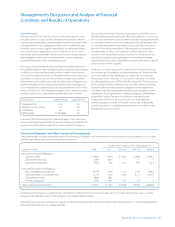
Walmart U.S. Segment
Fiscal Years Ended January 31,
(Amounts in millions, except unit counts) 2012 2011 2010
Net sales $264,186 $260,261 $259,919
Percentage change from
previous fi scal year 1.5% 0.1% 1.1%
Calendar comparable store sales 0.3% -1.5% -0.7%
Operating income $ 20,367 $ 19,919 $ 19,314
Operating income as
a percentage of net sales 7.7% 7.7% 7.4%
Unit counts 3,868 3,804 3,755
Retail square feet 627 617 606