Walmart 2012 Annual Report Download - page 26
Download and view the complete annual report
Please find page 26 of the 2012 Walmart annual report below. You can navigate through the pages in the report by either clicking on the pages listed below, or by using the keyword search tool below to find specific information within the annual report.-
 1
1 -
2
-
3
-
4
-
5
-
6
-
7
-
8
-
9
-
10
-
11
-
12
-
13
-
14
-
15
-
 16
16 -
 17
17 -
 18
18 -
 19
19 -
 20
20 -
 21
21 -
 22
22 -
 23
23 -
 24
24 -
 25
25 -
 26
26 -
 27
27 -
 28
28 -
 29
29 -
 30
30 -
 31
31 -
 32
32 -
 33
33 -
 34
34 -
 35
35 -
 36
36 -
37
-
38
-
39
-
40
-
41
-
42
-
43
-
44
-
45
-
46
-
47
-
48
-
49
-
50
-
51
-
52
-
53
-
54
-
55
-
56
-
57
-
58
-
59
-
60
-
61
-
62
 |
 |

Management’s Discussion and Analysis of Financial
Condition and Results of Operations
24 Walmart 2012 Annual Report
Net sales for the Walmart U.S. segment increased 1.5% and 0.1% in fi scal
2012 and 2011, respectively, compared to the previous fi scal year. The
increase in net sales for fi scal 2012 compared to fi scal 2011 is primarily
due to a 1.6% increase in year-over-year retail square feet. Walmart U.S.
net sales were relatively fl at for fi scal 2011 compared to fi scal 2010 as
growth in retail square feet was off set by a decline in comparable store
sales of 1.5% caused by slower customer traffi c.
Gross profi t margin was relatively fl at in fi scal 2012 and 2011, respectively,
compared to the previous fi scal year.
Operating expenses, as a percentage of segment net sales, declined
10 basis points during fi scal 2012 compared to fi scal 2011, as the segment
focused on improved labor productivity and managing expenses.
Operating expenses, as a percentage of net sales, decreased by 28 basis
points in fi scal 2011 compared to fi scal 2010 due to improved labor
productivity and a reduction in incentive plan expenses.
As a result of the factors discussed above, operating income was
$20.4 billion, $19.9 billion and $19.3 billion for fi scal 2012, 2011 and
2010, respectively.
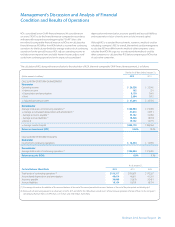
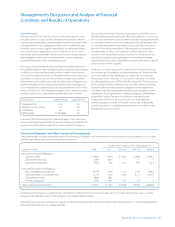
Walmart International Segment
Fiscal Years Ended January 31,
(Amounts in millions, except unit counts) 2012 2011 2010
Net sales $125,873 $109,232 $97,407
Percentage change from
previous fi scal year 15.2% 12.1% 1.3%
Operating income $ 6,214 $ 5,606 $ 4,901
Operating income as
a percentage of net sales 4.9% 5.1% 5.0%
Unit counts 5,651 4,557 4,099
Retail square feet 329 287 266
Net sales for the Walmart International segment increased 15.2% and
12.1% for fi scal 2012 and 2011, respectively, compared to the previous fi scal
year. The increase in net sales during fi scal 2012 compared to fi scal 2011
was due to year-over-year growth in retail square feet of 14.7%, including
acquisitions, constant currency sales growth in every country, $4.7 billion
of sales from the acquisitions of Massmart and Netto and currency trans-
lation benefi ts of $4.0 billion during fi scal 2012. Constant currency sales
grew 7.2 percent compared to fi scal 2011. Mexico, China and the United
Kingdom contributed the highest dollar increases to Walmart International’s
net sales growth in fi scal 2012, excluding the impact of acquisitions. The
increase in net sales for fi scal 2011 compared to fi scal 2010 was due to
year-over-year growth in retail square feet of 7.8%, $4.5 billion of favorable
currency translation benefi ts and constant currency sales growth in
nearly every country.
Gross profi t margin decreased 46 basis points for fi scal 2012 compared
to fi scal 2011, due primarily to the acquisitions of Netto and Massmart
included in the fi scal 2012 results and not in the fi scal 2011 results.
Constant currency gross margin as a percentage of sales was fl at in fi scal
2012 compared to fi scal 2011. Gross profi t margin was relatively
fl at in fi scal 2011 compared to fi scal 2010.
Segment operating expenses, as a percentage of segment net sales,
decreased 19 basis points in fi scal 2012 compared to fi scal 2011 due to the
acquisitions of Netto and Massmart in fi scal 2012. Constant currency oper-
ating expenses increased slower than sales at 6.2%. The United Kingdom,
Japan and Canada leveraged operating expenses most signifi cantly in
fi scal 2012. Operating expenses, as a percentage of net sales, decreased
26 basis points in fi scal 2011 compared to fi scal 2010 due to eff ective
expense management in Japan and the United Kingdom.
Each country had positive constant currency operating income in fi scal
2012, except India. India is a growing wholesale, cash and carry and retail
franchise business with many new locations and generated signifi cant
sales growth in fi scal 2012. Currency exchange rate fl uctuations increased
operating income by $105 million and $231 million in fi scal 2012 and 2011,
respectively. Volatility in currency exchange rates may continue to impact
the Walmart International segment’s operating results in the future.
As a result of the factors discussed above, operating income
was $6.2 billion, $5.6 billion and $4.9 billion for fi scal 2012, 2011 and
2010, respectively.
Sam’s Club Segment
We believe the information in the following table under the caption
“Excluding Fuel” is useful to investors because it permits investors to
understand the eff ect of the Sam’s Club segment’s fuel sales, which are
impacted by the volatility of fuel prices.
Fiscal Years Ended January 31,
(Amounts in millions, except unit counts) 2012 2011 2010
Including Fuel
Net sales $53,795 $49,459 $47,806
Percentage change from
previous fi scal year 8.8% 3.5% -0.4%
Calendar comparable club sales 8.4% 3.9% -1.4%
Operating income $ 1,865 $ 1,711 $ 1,515
Operating income as
a percentage of net sales 3.5% 3.5% 3.2%
Unit counts 611 609 605
Retail square feet 82 81 81
Excluding Fuel
Net sales $47,616 $45,193 $44,553
Percentage change from
previous fi scal year 5.4% 1.4% 1.7%
Calendar comparable club sales 5.0% 1.9% 0.7%
Operating income $ 1,826 $ 1,692 $ 1,525
Operating income as
a percentage of net sales 3.8% 3.7% 3.4%