Walmart 2012 Annual Report Download - page 28
Download and view the complete annual report
Please find page 28 of the 2012 Walmart annual report below. You can navigate through the pages in the report by either clicking on the pages listed below, or by using the keyword search tool below to find specific information within the annual report.-
 1
1 -
2
-
3
-
4
-
5
-
6
-
7
-
8
-
9
-
10
-
11
-
12
-
13
-
14
-
15
-
16
-
17
-
 18
18 -
 19
19 -
 20
20 -
 21
21 -
 22
22 -
 23
23 -
 24
24 -
 25
25 -
 26
26 -
 27
27 -
 28
28 -
 29
29 -
 30
30 -
 31
31 -
 32
32 -
 33
33 -
 34
34 -
 35
35 -
 36
36 -
 37
37 -
 38
38 -
39
-
40
-
41
-
42
-
43
-
44
-
45
-
46
-
47
-
48
-
49
-
50
-
51
-
52
-
53
-
54
-
55
-
56
-
57
-
58
-
59
-
60
-
61
-
62
 |
 |

Management’s Discussion and Analysis of Financial
Condition and Results of Operations
26 Walmart 2012 Annual Report
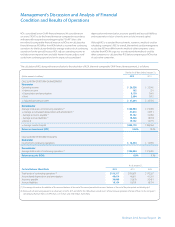
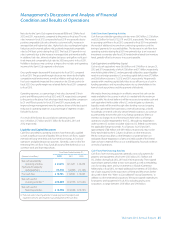
Global Expansion Activities
We expect to fi nance our fi scal 2013 global expansion plans primarily through
cash fl ows from operations and future debt fi nancings. The following
table represents our estimated range for capital expenditures and growth
in retail square feet by segment for fi scal 2013. This table does not include
growth in retail square feet from pending or future acquisitions.
Fiscal Year 2013 Fiscal Year 2013
Projected Capital Projected Growth in
Expenditures Retail Square Feet
(in billions) (in thousands)
Walmart U.S. segment
(including Other) $ 7.0 to $ 7.5 14,000 to 15,000
Sam’s Club segment 1.0 to 1.0 1,000 to 1,000
Total U.S. 8.0 to 8.5 15,000 to 16,000
Walmart International segment 5.0 to 5.5 30,000 to 33,000
Grand Total 13.0 to 14.0 45,000 to 49,000
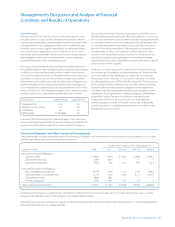
The following table represents the allocation of our capital expenditures
for property and equipment:
Allocation of Capital Expenditures
Fiscal Years Ending January 31,
Projected Actual
2013 2012 2011
New stores and clubs, including
expansions and relocations 37% 28% 24%
Remodels 8% 12% 26%
Information systems, distribution
and other 18% 21% 19%
Total United States 63% 61% 69%
Walmart International 37% 39% 31%
Total Capital Expenditures 100% 100% 100%
Cash Flows from Financing Activities
Cash fl ows from fi nancing activities generally consist of transactions
related to our short- and long-term debt, as well as dividends paid and
the repurchase of Company stock.
Short-Term Borrowings
Net short-term borrowings increased by $3.0 billion and $503 million in
fi scal 2012 and fi scal 2011, respectively, and decreased by $1.0 billion in
fi scal 2010. From time to time, we utilize the liquidity under our short-
term borrowing programs to fund our operations, dividend payments,
share repurchases, capital expenditures and for other cash requirements
and corporate purposes on an as-needed basis. We utilized the favorable
interest rates available on our commercial paper and increased our short-
term borrowings throughout fi scal 2012.
Long-Term Debt
Proceeds from the issuance of long-term debt were $5.1 billion,
$11.4 billion and $5.5 billion for fi scal 2012, 2011 and 2010, respectively.
The proceeds from the issuance of long-term debt were used to pay
down or refi nance existing debt, and for other general corporate purposes.
Information on our signifi cant issuances of long-term debt during fi scal
2012 is as follows (amounts in millions):
Issue Date Maturity Date Interest Rate Principal Amount
April 18, 2011 April 15, 2014 1.625% $1,000
April 18, 2011 April 15, 2016 2.800% 1,000
April 18, 2011 April 15, 2021 4.250% 1,000
April 18, 2011 April 15, 2041 5.625% 2,000
Total $5,000
The notes of each series require semi-annual interest payments on
April 15 and October 15 of each year, with the fi rst interest payment
having commenced on October 15, 2011. Unless previously purchased
and canceled, the Company will repay the notes of each series at 100% of
their principal amount, together with accrued and unpaid interest
thereon, at their maturity. The notes of each series are senior, unsecured
obligations of the Company.
Dividends
On March 1, 2012, our Board of Directors approved an annual dividend
for fi scal 2013 of $1.59 per share, an increase of approximately 9% over
the dividends paid in fi scal 2012. Dividends per share were $1.46 and
$1.21 in fi scal 2012 and 2011, respectively. For fi scal 2013, the annual divi-
dend will be paid in four quarterly installments of $0.3975 per share,
according to the following record and payable dates:
Record Date Payable Date
March 12, 2012 April 4, 2012
May 11, 2012 June 4, 2012
August 10, 2012 September 4, 2012
December 7, 2012 January 2, 2013
We paid aggregate dividends of $5.0 billion, $4.4 billion and $4.2 billion
for fi scal 2012, 2011 and 2010, respectively. We expect to pay aggregate
dividends of approximately $5.4 billion in fi scal 2013.
Company Share Repurchase Program
From time to time, we have repurchased shares of our common stock
under share repurchase programs authorized by the Board of Directors.
The current share repurchase program has no expiration date or other
restriction limiting the period over which we can make share repur-
chases. At January 31, 2012, authorization for $11.3 billion of additional
share repurchases remained under the current share repurchase pro-
gram. Any repurchased shares are constructively retired and returned to
an unissued status.
We consider several factors in determining when to execute the share
repurchases, including, among other things, current cash needs, capacity
for leverage, cost of borrowings and the market price of our common
stock. Cash paid for share repurchases during fi scal 2012, 2011 and 2010
was as follows:
Total Number
of Shares Average Total
Repurchased Price Paid Investment
Share Repurchases (in millions) per Share (in billions)
Fiscal year ended January 31, 2012 115.3 $54.64 $ 6.3
Fiscal year ended January 31, 2011 279.1 $ 53.03 $ 14.8
Fiscal year ended January 31, 2010 145.5 $ 50.17 $ 7.3