eBay 2012 Annual Report Download - page 110
Download and view the complete annual report
Please find page 110 of the 2012 eBay annual report below. You can navigate through the pages in the report by either clicking on the pages listed below, or by using the keyword search tool below to find specific information within the annual report.-
 1
1 -
2
-
3
-
4
-
5
-
6
-
7
-
8
-
9
-
10
-
11
-
12
-
13
-
14
-
15
-
16
-
17
-
18
-
19
-
20
-
21
-
22
-
23
-
24
-
25
-
26
-
27
-
28
-
29
-
30
-
31
-
32
-
33
-
34
-
35
-
36
-
37
-
38
-
39
-
40
-
41
-
42
-
43
-
44
-
45
-
46
-
47
-
48
-
49
-
50
-
51
-
52
-
53
-
54
-
55
-
56
-
57
-
58
-
59
-
60
-
61
-
62
-
63
-
64
-
65
-
66
-
67
-
68
-
69
-
70
-
71
-
72
-
73
-
74
-
75
-
76
-
77
-
78
-
79
-
80
-
81
-
82
-
83
-
84
-
85
-
86
-
87
-
88
-
89
-
90
-
91
-
92
-
93
-
94
-
95
-
96
-
97
-
98
-
99
-
 100
100 -
 101
101 -
 102
102 -
 103
103 -
 104
104 -
 105
105 -
 106
106 -
 107
107 -
 108
108 -
 109
109 -
 110
110 -
 111
111 -
 112
112 -
 113
113 -
 114
114 -
 115
115 -
 116
116 -
 117
117 -
 118
118 -
 119
119 -
 120
120 -
121
-
122
-
123
-
124
-
125
-
126
-
127
-
128
-
129
-
130
-
131
-
132
-
133
-
134
-
135
-
136
-
137
-
138
-
139
-
140
-
141
-
142
-
143
-
144
-
145
-
146
-
147
-
148
-
149
-
150
-
151
-
152
-
153
-
154
-
155
-
156
-
157
-
158
-
159
-
160
-
161
-
162
 |
 |

eBay Inc.
NOTES TO CONSOLIDATED FINANCIAL STATEMENTS—(Continued)
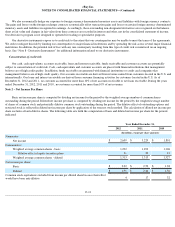
Expected future intangible asset amortization as of December 31, 2012 is as follows (in millions):
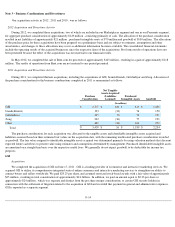
Note 5 – Segments
We have three reporting segments: Marketplaces, Payments and GSI. We allocate resources to and assess the performance of each
reporting segment using information about its revenue and operating income (loss). We do not evaluate operating segments using discrete asset
information. We do not allocate gains and losses from equity investments, interest and other income, or taxes to operating segments.
The corporate and other category includes income, expenses and charges such as:
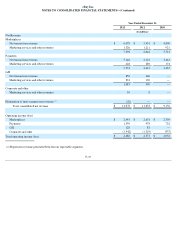
The following tables summarize the financial performance of our reporting segments and provide a reconciliation to our consolidated
operating results for the periods reflected below (data for the year ended December 31, 2011 include GSI since the date of acquisition):
F-18
Fiscal years:
2013
$
408
2014
299
2015
244
2016
121
2017
32
Thereafter
24
$
1,128
•
results of operations of various initiatives which support all of our reporting segments;
•
corporate management costs, such as human resources, finance and legal, not allocated to our segments;
•
amortization of intangible assets;
•
restructuring charges; and
• stock-
based compensation expense.