eBay 2012 Annual Report Download - page 135
Download and view the complete annual report
Please find page 135 of the 2012 eBay annual report below. You can navigate through the pages in the report by either clicking on the pages listed below, or by using the keyword search tool below to find specific information within the annual report.-
 1
1 -
2
-
3
-
4
-
5
-
6
-
7
-
8
-
9
-
10
-
11
-
12
-
13
-
14
-
15
-
16
-
17
-
18
-
19
-
20
-
21
-
22
-
23
-
24
-
25
-
26
-
27
-
28
-
29
-
30
-
31
-
32
-
33
-
34
-
35
-
36
-
37
-
38
-
39
-
40
-
41
-
42
-
43
-
44
-
45
-
46
-
47
-
48
-
49
-
50
-
51
-
52
-
53
-
54
-
55
-
56
-
57
-
58
-
59
-
60
-
61
-
62
-
63
-
64
-
65
-
66
-
67
-
68
-
69
-
70
-
71
-
72
-
73
-
74
-
75
-
76
-
77
-
78
-
79
-
80
-
81
-
82
-
83
-
84
-
85
-
86
-
87
-
88
-
89
-
90
-
91
-
92
-
93
-
94
-
95
-
96
-
97
-
98
-
99
-
100
-
101
-
102
-
103
-
104
-
105
-
106
-
107
-
108
-
109
-
110
-
111
-
112
-
113
-
114
-
115
-
116
-
117
-
118
-
119
-
120
-
121
-
122
-
123
-
124
-
 125
125 -
 126
126 -
 127
127 -
 128
128 -
 129
129 -
 130
130 -
 131
131 -
 132
132 -
 133
133 -
 134
134 -
 135
135 -
 136
136 -
 137
137 -
 138
138 -
 139
139 -
 140
140 -
 141
141 -
 142
142 -
 143
143 -
 144
144 -
 145
145 -
146
-
147
-
148
-
149
-
150
-
151
-
152
-
153
-
154
-
155
-
156
-
157
-
158
-
159
-
160
-
161
-
162
 |
 |

eBay Inc.
NOTES TO CONSOLIDATED FINANCIAL STATEMENTS—(Continued)
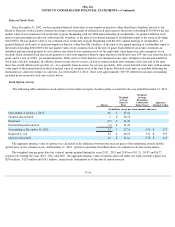
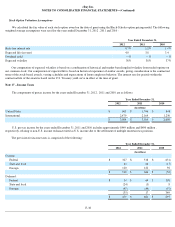
The following is a reconciliation of the difference between the actual provision for income taxes and the provision computed by applying
the federal statutory rate of 35% for 2012 , 2011 and 2010 to income before income taxes:
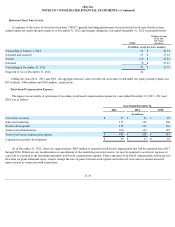
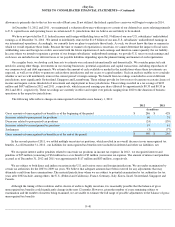
Deferred tax assets and liabilities are recognized for the future tax consequences of differences between the carrying amounts of assets
and liabilities and their respective tax bases using enacted tax rates in effect for the year in which the differences are expected to be reversed.
Significant deferred tax assets and liabilities consist of the following:
As of December 31, 2012 , our federal, foreign and state net operating loss carryforwards for income tax purposes were approximately
$68
million , $207 million and $478 million , respectively. The federal and state net operating loss carryforwards are subject to various limitations
under Section 382 of the Internal Revenue Code and applicable state tax laws. If not utilized, the federal net operating loss carryforwards will
begin to expire in 2021 and the state net operating loss carryforwards will begin to expire in 2014. As of December 31, 2012 , our federal and
state tax credit carryforwards for income tax purposes were approximately $4 million and $19 million , respectively. If not utilized, the federal
tax credit carryforwards will begin to expire in 2019 and the state tax credit carryforwards will begin to expire in 2016.
As of December 31, 2012 and 2011, our federal capital loss carryover amounted to $344 million and $151 million , respectively, which is
subject to a full valuation allowance. The increase in the capital loss carryover and associated valuation
Year Ended December 31,
2012
2011
2010
(In millions)
Provision at statutory rate
$
1,080
$
1,369
$
734
Permanent differences:
Foreign income taxed at different rates
(617
)
(1,093
)
(441
)
Gain on sale of Skype
—
321
—
Legal entity restructuring
—
—
(
24
)
Change in valuation allowance
3
(1
)
1
Stock-based compensation
(14
)
32
8
State taxes, net of federal benefit
39
21
31
Tax credits
1
(8
)
(49
)
Divested business
(41
)
34
—
Other
24
6
37
$
475
$
681
$
297
December 31,
2012
2011
(In millions)
Deferred tax assets:
Net operating loss, capital loss and credits
$
235
$
187
Accruals and allowances
355
340
Stock-based compensation
133
114
Discount on note receivable
55
68
Net unrealized losses
5
1
Net deferred tax assets
783
710
Valuation allowance
(169
)
(83
)
$
614
$
627
Deferred tax liabilities:
Unremitted foreign earnings
$
(220
)
$
(198
)
Acquisition-related intangibles
(357
)
(462
)
Depreciation and amortization
(302
)
(264
)
Available-for-sale securities
(237
)
(234
)
Other
(21
)
(21
)
(1,137
)
(1,179
)
$
(523
)
$
(552
)