eBay 2012 Annual Report Download - page 68
Download and view the complete annual report
Please find page 68 of the 2012 eBay annual report below. You can navigate through the pages in the report by either clicking on the pages listed below, or by using the keyword search tool below to find specific information within the annual report.-
 1
1 -
2
-
3
-
4
-
5
-
6
-
7
-
8
-
9
-
10
-
11
-
12
-
13
-
14
-
15
-
16
-
17
-
18
-
19
-
20
-
21
-
22
-
23
-
24
-
25
-
26
-
27
-
28
-
29
-
30
-
31
-
32
-
33
-
34
-
35
-
36
-
37
-
38
-
39
-
40
-
41
-
42
-
43
-
44
-
45
-
46
-
47
-
48
-
49
-
50
-
51
-
52
-
53
-
54
-
55
-
56
-
57
-
 58
58 -
 59
59 -
 60
60 -
 61
61 -
 62
62 -
 63
63 -
 64
64 -
 65
65 -
 66
66 -
 67
67 -
 68
68 -
 69
69 -
 70
70 -
 71
71 -
 72
72 -
 73
73 -
 74
74 -
 75
75 -
 76
76 -
 77
77 -
 78
78 -
79
-
80
-
81
-
82
-
83
-
84
-
85
-
86
-
87
-
88
-
89
-
90
-
91
-
92
-
93
-
94
-
95
-
96
-
97
-
98
-
99
-
100
-
101
-
102
-
103
-
104
-
105
-
106
-
107
-
108
-
109
-
110
-
111
-
112
-
113
-
114
-
115
-
116
-
117
-
118
-
119
-
120
-
121
-
122
-
123
-
124
-
125
-
126
-
127
-
128
-
129
-
130
-
131
-
132
-
133
-
134
-
135
-
136
-
137
-
138
-
139
-
140
-
141
-
142
-
143
-
144
-
145
-
146
-
147
-
148
-
149
-
150
-
151
-
152
-
153
-
154
-
155
-
156
-
157
-
158
-
159
-
160
-
161
-
162
 |
 |

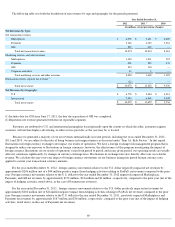
Marketplaces cost of net revenues increased $139 million, or 13%, in 2011 compared to 2010. The increase during 2011 was due primarily
to the impact of acquiring brands4friends during the first quarter of 2011 and increased customer support costs associated with our GMV growth.
Marketplaces cost of net revenues as a percentage of Marketplaces net revenues decreased during 2011 compared to the prior year due primarily
to improved operating leverage in our site operations infrastructure, partially offset by the impact of acquisitions. In addition, Marketplaces cost
of net revenues as a percentage of Marketplaces net revenues in 2010 was adversely impacted by the settlement of a lawsuit and the
establishment of a reserve related to certain indirect tax positions (recorded as a reduction in revenue).
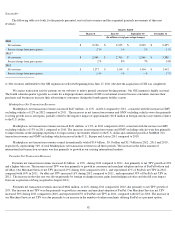
Payments
Payments cost of net revenues increased $343 million , or 18% , in 2012 compared to 2011 due primarily to the impact of growth in net
TPV. Payments cost of net revenues as a percentage of Payments net revenues decreased during 2012 compared to 2011
due primarily to a lower
transaction expense rate driven largely by the impact of certain regulatory changes, primarily the Durbin amendment of the Dodd-Frank Wall
Street Reform and Consumer Protection Act.
Payments cost of net revenues increased $373 million, or 25%, in 2011 compared to 2010 due primarily to the impact of growth in net
TPV. Payments cost of net revenues as a percentage of Payments net revenues decreased during 2011 compared to 2010 due primarily to a lower
transaction expense rate. The improvement in our transaction expense rate was driven primarily by the impact of certain regulatory changes, new
payment processing arrangements, a favorable mix shift to lower cost international markets and a small improvement in funding mix.
GSI
GSI cost of net revenues were $696 million during 2012 and $374 million in 2011. Cost of net revenues attributable to the GSI segment
for 2011 are reflected from June 17, 2011 (the date the acquisition of GSI was completed). Accordingly, comparisons with GSI's cost of
revenues for 2012 to 2011 are not meaningful.
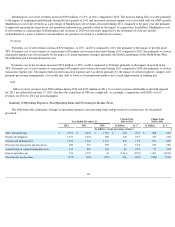
Summary of Operating Expenses, Non-Operating Items and Provision for Income Taxes
The following table summarizes changes in operating expenses, non-operating items and provision for income taxes for the periods
presented:
64
Year Ended December 31,
Change from
2011 to 2012
Change from
2010 to 2011
2012
2011
2010
in Dollars
in %
in Dollars
in %
(In millions, except percentage changes)
Sales and marketing
$
2,913
$
2,435
$
1,947
$
478
20
%
$
488
25
%
Product development
1,573
1,235
908
338
27
%
327
36
%
General and administrative
1,567
1,364
1,101
203
15
%
263
24
%
Provision for transaction and loan losses
580
517
392
63
12
%
125
32
%
Amortization of acquired intangible assets
335
267
190
68
25
%
77
41
%
Interest and other, net
196
1,537
44
(1,341
)
(87
)%
1,493
3,324
%
Provision for income taxes
(475
)
(681
)
(297
)
206
(30
)%
(384
)
129
%