eBay 2012 Annual Report Download - page 133
Download and view the complete annual report
Please find page 133 of the 2012 eBay annual report below. You can navigate through the pages in the report by either clicking on the pages listed below, or by using the keyword search tool below to find specific information within the annual report.-
 1
1 -
2
-
3
-
4
-
5
-
6
-
7
-
8
-
9
-
10
-
11
-
12
-
13
-
14
-
15
-
16
-
17
-
18
-
19
-
20
-
21
-
22
-
23
-
24
-
25
-
26
-
27
-
28
-
29
-
30
-
31
-
32
-
33
-
34
-
35
-
36
-
37
-
38
-
39
-
40
-
41
-
42
-
43
-
44
-
45
-
46
-
47
-
48
-
49
-
50
-
51
-
52
-
53
-
54
-
55
-
56
-
57
-
58
-
59
-
60
-
61
-
62
-
63
-
64
-
65
-
66
-
67
-
68
-
69
-
70
-
71
-
72
-
73
-
74
-
75
-
76
-
77
-
78
-
79
-
80
-
81
-
82
-
83
-
84
-
85
-
86
-
87
-
88
-
89
-
90
-
91
-
92
-
93
-
94
-
95
-
96
-
97
-
98
-
99
-
100
-
101
-
102
-
103
-
104
-
105
-
106
-
107
-
108
-
109
-
110
-
111
-
112
-
113
-
114
-
115
-
116
-
117
-
118
-
119
-
120
-
121
-
122
-
 123
123 -
 124
124 -
 125
125 -
 126
126 -
 127
127 -
 128
128 -
 129
129 -
 130
130 -
 131
131 -
 132
132 -
 133
133 -
 134
134 -
 135
135 -
 136
136 -
 137
137 -
 138
138 -
 139
139 -
 140
140 -
 141
141 -
 142
142 -
 143
143 -
144
-
145
-
146
-
147
-
148
-
149
-
150
-
151
-
152
-
153
-
154
-
155
-
156
-
157
-
158
-
159
-
160
-
161
-
162
 |
 |

eBay Inc.
NOTES TO CONSOLIDATED FINANCIAL STATEMENTS—(Continued)
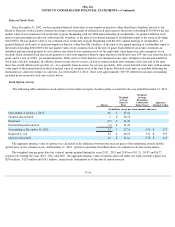
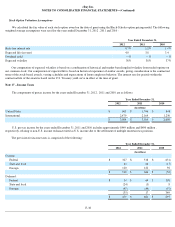
Restricted Stock Unit Activity
A summary of the status of restricted stock units ("RSU") granted (including performance-based restricted stock units that have been
earned) under our equity incentive plans as of December 31, 2012 and changes during the year ended December 31, 2012 is presented below:
During the years 2012 , 2011 and 2010 , the aggregate intrinsic value of restricted stock units vested under our equity incentive plans was
$591 million , $466 million and $363 million , respectively.
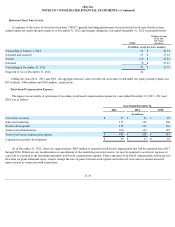
Stock-based Compensation Expense
The impact on our results of operations of recording stock-based compensation expense for years ended December 31, 2012 , 2011 and
2010 was as follows:
As of December 31, 2012 , there was approximately $865 million of unearned stock-based compensation that will be expensed from 2013
through 2016. If there are any modifications or cancellations of the underlying unvested awards, we may be required to accelerate, increase or
cancel all or a portion of the remaining unearned stock-based compensation expense. Future unearned stock-based compensation will increase to
the extent we grant additional equity awards, change the mix of grants between stock options and restricted stock units or assume unvested
equity awards in connection with acquisitions.
F-37
Units
Weighted Average
Grant-Date
Fair Value
(per share)
(In millions, except per share amounts)
Outstanding at January 1, 2012
40
$
24.74
Awarded and assumed
19
$
37.63
Vested
(15
)
$
22.83
Forfeited
(5
)
$
27.43
Outstanding at December 31, 2012
39
$
31.35
Expected to vest at December 31, 2012
34
Year Ended December 31,
2012
2011
2010
(In millions)
Cost of net revenues
$
55
$
56
$
49
Sales and marketing
135
132
106
Product development
138
123
101
General and administrative
160
147
125
Total stock-based compensation expense
$
488
$
458
$
381
Capitalized in product development
$
19
$
17
$
10