eBay 2012 Annual Report Download - page 69
Download and view the complete annual report
Please find page 69 of the 2012 eBay annual report below. You can navigate through the pages in the report by either clicking on the pages listed below, or by using the keyword search tool below to find specific information within the annual report.-
 1
1 -
2
-
3
-
4
-
5
-
6
-
7
-
8
-
9
-
10
-
11
-
12
-
13
-
14
-
15
-
16
-
17
-
18
-
19
-
20
-
21
-
22
-
23
-
24
-
25
-
26
-
27
-
28
-
29
-
30
-
31
-
32
-
33
-
34
-
35
-
36
-
37
-
38
-
39
-
40
-
41
-
42
-
43
-
44
-
45
-
46
-
47
-
48
-
49
-
50
-
51
-
52
-
53
-
54
-
55
-
56
-
57
-
58
-
 59
59 -
 60
60 -
 61
61 -
 62
62 -
 63
63 -
 64
64 -
 65
65 -
 66
66 -
 67
67 -
 68
68 -
 69
69 -
 70
70 -
 71
71 -
 72
72 -
 73
73 -
 74
74 -
 75
75 -
 76
76 -
 77
77 -
 78
78 -
 79
79 -
80
-
81
-
82
-
83
-
84
-
85
-
86
-
87
-
88
-
89
-
90
-
91
-
92
-
93
-
94
-
95
-
96
-
97
-
98
-
99
-
100
-
101
-
102
-
103
-
104
-
105
-
106
-
107
-
108
-
109
-
110
-
111
-
112
-
113
-
114
-
115
-
116
-
117
-
118
-
119
-
120
-
121
-
122
-
123
-
124
-
125
-
126
-
127
-
128
-
129
-
130
-
131
-
132
-
133
-
134
-
135
-
136
-
137
-
138
-
139
-
140
-
141
-
142
-
143
-
144
-
145
-
146
-
147
-
148
-
149
-
150
-
151
-
152
-
153
-
154
-
155
-
156
-
157
-
158
-
159
-
160
-
161
-
162
 |
 |

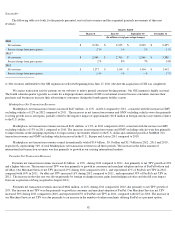
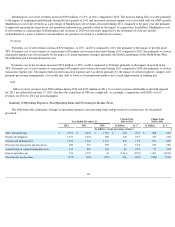
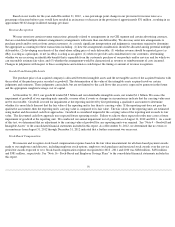
The following table summarizes operating expenses, non-operating items and provision for income taxes as a percentage of net revenues
for the periods presented:
Sales and Marketing
Sales and marketing expenses consist primarily of advertising costs and marketing programs (both online and offline), employee
compensation, contractor costs, facilities costs and depreciation on equipment. Online marketing expenses represent traffic acquisition costs in
various channels such as paid search, affiliates marketing and display advertising. Offline advertising includes brand campaigns, buyer/seller
communications and general public relations expenses. A significant portion of our sales and marketing expense is attributable to our online
marketing programs, primarily paid search, which include keyword advertising and third party lead generation costs, in order to drive traffic to
our Marketplaces and Payments websites.
Sales and marketing expense increased by $478 million , or 20% , in 2012 compared to 2011
. The increase in sales and marketing expense
was due primarily to higher employee-related expenses (including consultant costs, facility costs and equipment-related costs), marketing
program costs to drive consumer engagement and the impact from acquisitions, primarily GSI. Sales and marketing expense as a percentage of
net revenues were 21% in both 2012 and 2011.
Sales and marketing expense increased by $488 million, or 25%, in 2011 compared to 2010. The increase in sales and marketing expense
was due primarily to higher marketing program costs, employee-related expenses (including consultant costs, facility costs and equipment-
related costs) and the impact from acquisitions, primarily GSI. Sales and marketing expense as a percentage of net revenues were 21% in both
2011 and 2010.
Product Development
Product development expenses consist primarily of employee compensation, contractor costs, facilities costs and depreciation on
equipment. Product development expenses are net of required capitalization of major site and other product development efforts, including the
development of our next generation platform architecture, migration of certain platforms, seller tools and Payments services projects. Our top
technology priorities include mobile, user experience, search, platform and new products such as PayPal Here. Capitalized site and product
development costs were $285 million , $212 million and $193 million in 2012 , 2011 and 2010 , respectively, and are primarily reflected as a
cost of net revenues when amortized in future periods.
Product development expenses increased by $338 million , or 27% , in 2012 compared to 2011 . The increase was due primarily to higher
employee-related costs (including consultant costs, facility costs and equipment-related costs) driven by increased investment in platform,
search, mobile, and offline and the impact from acquisitions, primarily GSI. Product development expenses as a net percentage of revenues were
11% in both 2012 and 2011.
Product development expenses increased by $327 million, or 36%, in 2011 compared to 2010. The increase was due primarily to higher
employee-related costs (including consultant costs, facility costs and equipment-related costs) driven by increased investment in our top
technology priorities and the impact from acquisitions. Product development expenses as a percentage of net revenues were 11% and 10% in
2011 and 2010, respectively.
65
Year Ended December 31,
2012
2011
2010
Sales and marketing
21
%
21
%
21
%
Product development
11
%
11
%
10
%
General and administrative
11
%
12
%
12
%
Provision for transaction and loan losses
4
%
4
%
4
%
Amortization of acquired intangible assets
2
%
2
%
2
%
Interest and other, net
1
%
13
%
—
%
Provision for income taxes
3
%
6
%
3
%