eBay 2012 Annual Report Download - page 61
Download and view the complete annual report
Please find page 61 of the 2012 eBay annual report below. You can navigate through the pages in the report by either clicking on the pages listed below, or by using the keyword search tool below to find specific information within the annual report.-
 1
1 -
2
-
3
-
4
-
5
-
6
-
7
-
8
-
9
-
10
-
11
-
12
-
13
-
14
-
15
-
16
-
17
-
18
-
19
-
20
-
21
-
22
-
23
-
24
-
25
-
26
-
27
-
28
-
29
-
30
-
31
-
32
-
33
-
34
-
35
-
36
-
37
-
38
-
39
-
40
-
41
-
42
-
43
-
44
-
45
-
46
-
47
-
48
-
49
-
50
-
 51
51 -
 52
52 -
 53
53 -
 54
54 -
 55
55 -
 56
56 -
 57
57 -
 58
58 -
 59
59 -
 60
60 -
 61
61 -
 62
62 -
 63
63 -
 64
64 -
 65
65 -
 66
66 -
 67
67 -
 68
68 -
 69
69 -
 70
70 -
 71
71 -
72
-
73
-
74
-
75
-
76
-
77
-
78
-
79
-
80
-
81
-
82
-
83
-
84
-
85
-
86
-
87
-
88
-
89
-
90
-
91
-
92
-
93
-
94
-
95
-
96
-
97
-
98
-
99
-
100
-
101
-
102
-
103
-
104
-
105
-
106
-
107
-
108
-
109
-
110
-
111
-
112
-
113
-
114
-
115
-
116
-
117
-
118
-
119
-
120
-
121
-
122
-
123
-
124
-
125
-
126
-
127
-
128
-
129
-
130
-
131
-
132
-
133
-
134
-
135
-
136
-
137
-
138
-
139
-
140
-
141
-
142
-
143
-
144
-
145
-
146
-
147
-
148
-
149
-
150
-
151
-
152
-
153
-
154
-
155
-
156
-
157
-
158
-
159
-
160
-
161
-
162
 |
 |

ITEM 7: MANAGEMENT'S DISCUSSION AND ANALYSIS OF FINANCIAL CONDITION AND RESULTS OF OPERATIONS
FORWARD-LOOKING STATEMENTS
This Annual Report on Form 10-K contains forward-looking statements within the meaning of Section 27A of the Securities Act of 1933
and Section 21E of the Securities Exchange Act of 1934, including statements that involve expectations, plans or intentions (such as those
relating to future business, future results of operations or financial condition, new or planned features or services, or management strategies).
You can identify these forward-looking statements by words such as “may,” “will,” “would,” “should,” “could,” “expect,” “anticipate,”
“believe,” “estimate,” “intend,” “plan” and other similar expressions. These forward-looking statements involve risks and uncertainties that
could cause our actual results to differ materially from those expressed or implied in our forward-looking statements. Such risks and
uncertainties include, among others, those discussed in “Item 1A: Risk Factors” of this Annual Report on Form 10-K, as well as in our
consolidated financial statements, related notes, and the other information appearing elsewhere in this report and our other filings with the
SEC. We do not intend, and undertake no obligation, to update any of our forward-looking statements after the date of this report to reflect
actual results or future events or circumstances. Given these risks and uncertainties, readers are cautioned not to place undue reliance on such
forward
-looking statements. You should read the following Management's Discussion and Analysis of Financial Condition and Results of
Operations in conjunction with the consolidated financial statements and the related notes included in this report.
Overview
We have three reportable business segments: Marketplaces, Payments and GSI. Our Marketplaces segment includes our eBay.com
platform and its localized counterparts and our other online trading platforms, such as our online classifieds businesses and StubHub. Our
Payments segment is comprised of PayPal, Bill Me Later and Zong. Our GSI segment was added upon the completion of our acquisition of GSI
Commerce, Inc. (GSI) on June 17, 2011. The results of our GSI segment have been included in our consolidated results of operations from the
acquisition date.
In 2012 , net revenues increased 21% to $14.1 billion compared to $11.7 billion in 2011 , driven primarily by increases in net revenues
from each of our business segments. We achieved an operating margin of 21% in 2012 compared to 20% in 2011 . Our diluted earnings per
share decreased to $1.99 in 2012 , a $0.47 decrease per share compared to 2011 , driven primarily by the gain resulting from the sale of our
remaining 30% equity interest in Skype in 2011, offset in part by growth in 2012 net revenues and a lower effective tax rate. We generated cash
flow from operations of approximately $3.8 billion in 2012 compared to $3.3 billion in 2011 .
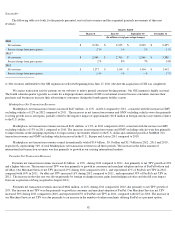
Our Marketplaces segment total net revenues increased $756 million , or 11% , in 2012 compared to 2011 . The increase in total net
revenues was driven primarily by an increase in GMV (as defined below) excluding vehicles of 12% , which was attributable to strong growth
across all regions, partially offset by the negative impact of foreign currency movements relative to the U.S. dollar. Our Marketplaces segment
operating margin of 39.8% for 2012 remained flat compared to 2011.
Our Payments segment total net revenues increased $1.2 billion , or 26% , in 2012 compared to 2011 . The increase in total net revenues
was driven primarily by a year-over-year increase in net TPV (as defined below) of 22% due to the expansion of our global footprint with
international net TPV increasing 26% in 2012 versus 2011. Our Payments segment operating margin increased 2 percentage points in 2012
compared to 2011, due primarily to a higher take rate and lower transaction processing costs.
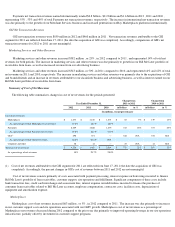
Our GSI segment had total net revenues of $1.1 billion in 2012 and a segment operating margin of 11.8% . Net revenues attributable to
the GSI segment for 2011 are reflected from June 17, 2011 (the date the acquisition of GSI was completed). Accordingly, comparisons with
GSI's net revenues for 2012 to 2011 are not meaningful.
In 2011, net revenues increased 27% to $11.7 billion compared to $9.2 billion in 2010, driven primarily by a 29% increase in PayPal net
TPV and a 13% increase in Marketplaces GMV excluding vehicles, as well as the impact from GSI, which we acquired in June 2011. We
achieved an operating margin of 20% in 2011 compared to 22% in 2010. This reduction in operating margin was driven primarily by the impact
of acquisitions. Our diluted earnings per share increased to $2.46 in 2011, a $1.10 increase compared to 2010, driven primarily by a gain
resulting from the sale of our remaining 30% interest in Skype and growth in net revenue, partially offset by the impact of a loss on a divested
business, acquisitions and a higher tax rate. We generated cash flow from operations of approximately $3.3 billion in 2011 compared to $2.7
billion in 2010.
Some key operating metrics that members of our senior management regularly review to evaluate our financial results include net
promoter score (NPS), market share, GMV, GMV excluding vehicles, number of sold items, net TPV, Merchant
58