eBay 2012 Annual Report Download - page 72
Download and view the complete annual report
Please find page 72 of the 2012 eBay annual report below. You can navigate through the pages in the report by either clicking on the pages listed below, or by using the keyword search tool below to find specific information within the annual report.-
 1
1 -
2
-
3
-
4
-
5
-
6
-
7
-
8
-
9
-
10
-
11
-
12
-
13
-
14
-
15
-
16
-
17
-
18
-
19
-
20
-
21
-
22
-
23
-
24
-
25
-
26
-
27
-
28
-
29
-
30
-
31
-
32
-
33
-
34
-
35
-
36
-
37
-
38
-
39
-
40
-
41
-
42
-
43
-
44
-
45
-
46
-
47
-
48
-
49
-
50
-
51
-
52
-
53
-
54
-
55
-
56
-
57
-
58
-
59
-
60
-
61
-
 62
62 -
 63
63 -
 64
64 -
 65
65 -
 66
66 -
 67
67 -
 68
68 -
 69
69 -
 70
70 -
 71
71 -
 72
72 -
 73
73 -
 74
74 -
 75
75 -
 76
76 -
 77
77 -
 78
78 -
 79
79 -
 80
80 -
 81
81 -
 82
82 -
83
-
84
-
85
-
86
-
87
-
88
-
89
-
90
-
91
-
92
-
93
-
94
-
95
-
96
-
97
-
98
-
99
-
100
-
101
-
102
-
103
-
104
-
105
-
106
-
107
-
108
-
109
-
110
-
111
-
112
-
113
-
114
-
115
-
116
-
117
-
118
-
119
-
120
-
121
-
122
-
123
-
124
-
125
-
126
-
127
-
128
-
129
-
130
-
131
-
132
-
133
-
134
-
135
-
136
-
137
-
138
-
139
-
140
-
141
-
142
-
143
-
144
-
145
-
146
-
147
-
148
-
149
-
150
-
151
-
152
-
153
-
154
-
155
-
156
-
157
-
158
-
159
-
160
-
161
-
162
 |
 |

and the operational and tax efficiency of our corporate structure, as well as the long-term cash flows and cash needs of our different
businesses. These transactions may impact our overall tax rate and/or result in additional cash tax payments. The impact in any period may be
significant. These transactions may be complex and the impact of such transactions on future periods may be difficult to estimate.
We are regularly under examination by tax authorities both domestically and internationally. We believe that adequate amounts have been
reserved for any adjustments that may ultimately result from these examinations, although we cannot assure you that this will be the case given
the inherent uncertainties in these examinations. Due to the ongoing tax examinations, we believe it is impractical to determine the amount and
timing of these adjustments.
Liquidity and Capital Resources
Cash Flows
Operating Activities
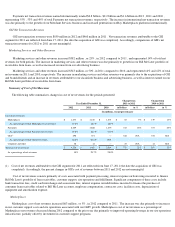
We generated cash from operating activities of $3.8 billion , $3.3 billion and $2.7 billion in 2012 , 2011 and 2010 , respectively. The
increase in cash provided by operating activities in 2012 compared to 2011 was due primarily to higher income from operations resulting from
growth in revenues.
The increase in cash provided by operating activities in 2011 compared to 2010 was due primarily to a decrease in cash paid for taxes in
2011. Cash paid for taxes in 2010 included a cash payment for taxes of approximately $207 million related primarily to a legal entity
restructuring completed in the fourth quarter 2009.
Cash paid for income taxes in 2012 , 2011 and 2010 was $789 million , $373 million and $646 million , respectively.
Investing Activities
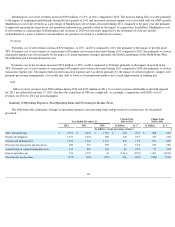
The net cash used in investing activities of $3.8 billion in 2012 was due primarily to net cash paid for purchases of investments of $3.1
billion , purchases of property and equipment, net, of $1.3 billion and the purchase of consumer loan receivables (net of collections) originated
through our Bill Me Later merchant network of $727 million , partially offset by proceeds of $1.4 billion for sales of investments.
The net cash used in investing activities of $3.3 billion in 2011 was due primarily to net cash paid for acquisition of businesses of $3.2
billion, purchases of investments of $2.3 billion, purchases of property and equipment, net, of $963 million and the purchase of consumer loan
receivables (net of collections) originated through our Bill Me Later merchant network of $587 million, partially offset by proceeds of $2.3
billion related to the sale of our remaining 30 percent interest in Skype and $1.6 billion from maturities and sales of investments.
Financing Activities
The net cash provided by financing activities of $2.0 billion in 2012 was due primarily to cash inflows of approximately $3.0 billion from
the issuance of senior notes, $483 million from the issuance of common stock in connection with the exercise of stock options and our employee
stock purchase plan, and $130 million in excess tax benefits from stock-based compensation. These cash inflows were partially offset by
outflows of $898 million in cash paid to repurchase our common stock, $550 million for the net repayment of commercial paper, and $186
million in cash paid for tax withholdings related to net share settlements of restricted stock units and nonvested share awards. We used a portion
of the net proceeds from the issuance of our senior notes to repay the commercial paper referred to above.
68
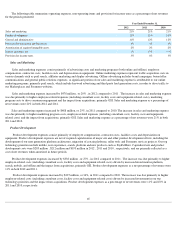
Year Ended December 31,
2012
2011
2010
(In millions)
Net cash provided by (used in):
Operating activities
3,838
3,274
2,746
Investing activities
(3,763
)
(3,307
)
(2,284
)
Financing activities
1,951
(838
)
1,235
Effect of exchange rates on cash and cash equivalents
100
(15
)
(120
)
Net increase/(decrease) in cash and cash equivalents
2,126
(886
)
1,577