eBay 2012 Annual Report Download - page 66
Download and view the complete annual report
Please find page 66 of the 2012 eBay annual report below. You can navigate through the pages in the report by either clicking on the pages listed below, or by using the keyword search tool below to find specific information within the annual report.-
 1
1 -
2
-
3
-
4
-
5
-
6
-
7
-
8
-
9
-
10
-
11
-
12
-
13
-
14
-
15
-
16
-
17
-
18
-
19
-
20
-
21
-
22
-
23
-
24
-
25
-
26
-
27
-
28
-
29
-
30
-
31
-
32
-
33
-
34
-
35
-
36
-
37
-
38
-
39
-
40
-
41
-
42
-
43
-
44
-
45
-
46
-
47
-
48
-
49
-
50
-
51
-
52
-
53
-
54
-
55
-
 56
56 -
 57
57 -
 58
58 -
 59
59 -
 60
60 -
 61
61 -
 62
62 -
 63
63 -
 64
64 -
 65
65 -
 66
66 -
 67
67 -
 68
68 -
 69
69 -
 70
70 -
 71
71 -
 72
72 -
 73
73 -
 74
74 -
 75
75 -
 76
76 -
77
-
78
-
79
-
80
-
81
-
82
-
83
-
84
-
85
-
86
-
87
-
88
-
89
-
90
-
91
-
92
-
93
-
94
-
95
-
96
-
97
-
98
-
99
-
100
-
101
-
102
-
103
-
104
-
105
-
106
-
107
-
108
-
109
-
110
-
111
-
112
-
113
-
114
-
115
-
116
-
117
-
118
-
119
-
120
-
121
-
122
-
123
-
124
-
125
-
126
-
127
-
128
-
129
-
130
-
131
-
132
-
133
-
134
-
135
-
136
-
137
-
138
-
139
-
140
-
141
-
142
-
143
-
144
-
145
-
146
-
147
-
148
-
149
-
150
-
151
-
152
-
153
-
154
-
155
-
156
-
157
-
158
-
159
-
160
-
161
-
162
 |
 |

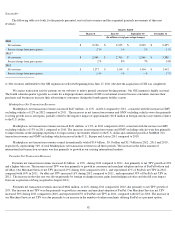
Payments net transaction revenues earned internationally totaled $2.8 billion , $2.2 billion and $1.6 billion in 2012 , 2011 and 2010 ,
representing 55% , 53% and 49% of total Payments net transaction revenues, respectively. The increase in international net transaction revenues
was due primarily to the growth of our Merchant Services business and increased penetration on eBay Marketplaces platforms internationally.
GSI Net Transaction Revenues
GSI net transaction revenues were $850 million in 2012 and $460 million in 2011 . Net transaction revenues attributable to the GSI
segment for 2011 are reflected from June 17, 2011 (the date the acquisition of GSI was completed). Accordingly, comparisons of GSI's net
transaction revenues for 2012 to 2011 are not meaningful.
Marketing Services and Other Revenues
Marketing services and other revenues increased $382 million , or 23% , in 2012 compared to 2011 , and represented 14% of total net
revenues for both periods. The increase in marketing services and other revenues was due primarily to growth in our Bill Me Later portfolio of
receivables from loans, as well as increased revenue from our advertising business.
Marketing services and other revenues increased $543 million, or 50%, in 2011 compared to 2010, and represented 14% and 12% of total
net revenues in 2011 and 2010, respectively. The increase in marketing services and other revenues was primarily due to the acquisitions of GSI
and brands4friends and an increase in revenues attributable to our classifieds business and advertising business, as well as interest earned on our
Bill Me Later portfolio of receivables from loans.
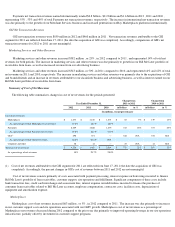
Summary of Cost of Net Revenues
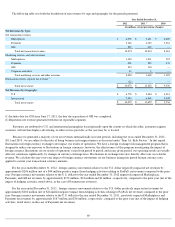
The following table summarizes changes in cost of net revenues for the periods presented:
Cost of net revenues consists primarily of costs associated with payment processing, interest expense on borrowings incurred to finance
Bill Me Later's portfolio of loan receivables, customer support, site operations and fulfillment. Significant components of these costs include
bank transaction fees, credit card interchange and assessment fees, interest expense on indebtedness incurred to finance the purchase of
consumer loan receivables related to Bill Me Later accounts, employee compensation, contractor costs, facilities costs, depreciation of
equipment and amortization expense.
Marketplaces
Marketplaces cost of net revenues increased $63 million , or 5% , in 2012 compared to 2011 . The increase was due primarily to increases
in our customer support costs and site operations associated with our GMV growth. Marketplaces cost of net revenues as a percentage of
Marketplaces net revenues decreased during 2012 compared to the prior year due primarily to improved operating leverage in our site operations
infrastructure, partially offset by investment in customer support programs.
Year Ended December 31,
Change from
2011 to 2012
Change from
2010 to 2011
2012
2011
2010
in Dollars
in %
in Dollars
in %
(In millions, except percentages)
Cost of net revenues:
Marketplaces
$
1,273
$
1,210
$
1,071
$
63
5
%
$
139
13
%
As a percentage of total Marketplaces net revenues
17.2
%
18.2
%
18.7
%
Payments
2,209
1,866
1,493
343
18
%
373
25
%
As a percentage of total Payments net revenues
39.6
%
42.3
%
43.5
%
GSI
(1)
696
374
—
322
N/A
374
N/A
As a percentage of total GSI net revenues
64.2
%
63.4
%
N/A
Corporate and other
38
11
—
27
N/A
11
N/A
Total cost of net revenues
$
4,216
$
3,461
$
2,564
$
755
22
%
$
897
35
%
As a percentage of net revenues
30
%
29.7
%
28.0
%
(1) Cost of net revenues attributable to the GSI segment for 2011 are reflected from June 17, 2011 (the date the acquisition of GSI was
completed). Accordingly, the percent changes in GSI's cost of revenues between 2011 and 2012 are not meaningful.