eBay 2012 Annual Report Download - page 111
Download and view the complete annual report
Please find page 111 of the 2012 eBay annual report below. You can navigate through the pages in the report by either clicking on the pages listed below, or by using the keyword search tool below to find specific information within the annual report.-
 1
1 -
2
-
3
-
4
-
5
-
6
-
7
-
8
-
9
-
10
-
11
-
12
-
13
-
14
-
15
-
16
-
17
-
18
-
19
-
20
-
21
-
22
-
23
-
24
-
25
-
26
-
27
-
28
-
29
-
30
-
31
-
32
-
33
-
34
-
35
-
36
-
37
-
38
-
39
-
40
-
41
-
42
-
43
-
44
-
45
-
46
-
47
-
48
-
49
-
50
-
51
-
52
-
53
-
54
-
55
-
56
-
57
-
58
-
59
-
60
-
61
-
62
-
63
-
64
-
65
-
66
-
67
-
68
-
69
-
70
-
71
-
72
-
73
-
74
-
75
-
76
-
77
-
78
-
79
-
80
-
81
-
82
-
83
-
84
-
85
-
86
-
87
-
88
-
89
-
90
-
91
-
92
-
93
-
94
-
95
-
96
-
97
-
98
-
99
-
100
-
 101
101 -
 102
102 -
 103
103 -
 104
104 -
 105
105 -
 106
106 -
 107
107 -
 108
108 -
 109
109 -
 110
110 -
 111
111 -
 112
112 -
 113
113 -
 114
114 -
 115
115 -
 116
116 -
 117
117 -
 118
118 -
 119
119 -
 120
120 -
 121
121 -
122
-
123
-
124
-
125
-
126
-
127
-
128
-
129
-
130
-
131
-
132
-
133
-
134
-
135
-
136
-
137
-
138
-
139
-
140
-
141
-
142
-
143
-
144
-
145
-
146
-
147
-
148
-
149
-
150
-
151
-
152
-
153
-
154
-
155
-
156
-
157
-
158
-
159
-
160
-
161
-
162
 |
 |

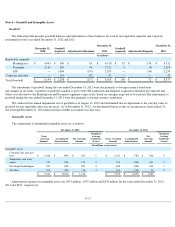
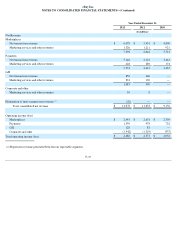
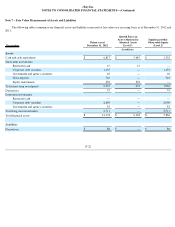
eBay Inc.
NOTES TO CONSOLIDATED FINANCIAL STATEMENTS—(Continued)
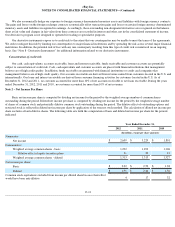
(1) Represents revenue generated between our reportable segments.
F-19
Year Ended December 31,
2012
2011
2010
(In millions)
Net Revenue
Marketplaces
Net transaction revenues
$
6,078
$
5,431
$
4,800
Marketing services and other revenues
1,320
1,211
921
7,398
6,642
5,721
Payments
Net transaction revenues
5,146
4,123
3,261
Marketing services and other revenues
428
289
174
5,574
4,412
3,435
GSI
Net transaction revenues
850
460
—
Marketing services and other revenues
233
130
—
1,083
590
—
Corporate and other
Marketing services and other revenues
39
8
—
Elimination of inter-segment net revenues
(1)
(22
)
—
—
Total consolidated net revenue
$
14,072
$
11,652
$
9,156
Operating income (loss)
Marketplaces
$
2,943
$
2,631
$
2,305
Payments
1,359
978
722
GSI
128
83
—
Corporate and other
(1,542
)
(1,319
)
(973
)
Total operating income (loss)
$
2,888
$
2,373
$
2,054