HSBC 2006 Annual Report Download - page 138
Download and view the complete annual report
Please find page 138 of the 2006 HSBC annual report below. You can navigate through the pages in the report by either clicking on the pages listed below, or by using the keyword search tool below to find specific information within the annual report.-
 1
1 -
2
-
3
-
4
-
5
-
6
-
7
-
8
-
9
-
10
-
11
-
12
-
13
-
14
-
15
-
16
-
17
-
18
-
19
-
20
-
21
-
22
-
23
-
24
-
25
-
26
-
27
-
28
-
29
-
30
-
31
-
32
-
33
-
34
-
35
-
36
-
37
-
38
-
39
-
40
-
41
-
42
-
43
-
44
-
45
-
46
-
47
-
48
-
49
-
50
-
51
-
52
-
53
-
54
-
55
-
56
-
57
-
58
-
59
-
60
-
61
-
62
-
63
-
64
-
65
-
66
-
67
-
68
-
69
-
70
-
71
-
72
-
73
-
74
-
75
-
76
-
77
-
78
-
79
-
80
-
81
-
82
-
83
-
84
-
85
-
86
-
87
-
88
-
89
-
90
-
91
-
92
-
93
-
94
-
95
-
96
-
97
-
98
-
99
-
100
-
101
-
102
-
103
-
104
-
105
-
106
-
107
-
108
-
109
-
110
-
111
-
112
-
113
-
114
-
115
-
116
-
117
-
118
-
119
-
120
-
121
-
122
-
123
-
124
-
125
-
126
-
127
-
 128
128 -
 129
129 -
 130
130 -
 131
131 -
 132
132 -
 133
133 -
 134
134 -
 135
135 -
 136
136 -
 137
137 -
 138
138 -
 139
139 -
 140
140 -
 141
141 -
 142
142 -
 143
143 -
 144
144 -
 145
145 -
 146
146 -
 147
147 -
 148
148 -
149
-
150
-
151
-
152
-
153
-
154
-
155
-
156
-
157
-
158
-
159
-
160
-
161
-
162
-
163
-
164
-
165
-
166
-
167
-
168
-
169
-
170
-
171
-
172
-
173
-
174
-
175
-
176
-
177
-
178
-
179
-
180
-
181
-
182
-
183
-
184
-
185
-
186
-
187
-
188
-
189
-
190
-
191
-
192
-
193
-
194
-
195
-
196
-
197
-
198
-
199
-
200
-
201
-
202
-
203
-
204
-
205
-
206
-
207
-
208
-
209
-
210
-
211
-
212
-
213
-
214
-
215
-
216
-
217
-
218
-
219
-
220
-
221
-
222
-
223
-
224
-
225
-
226
-
227
-
228
-
229
-
230
-
231
-
232
-
233
-
234
-
235
-
236
-
237
-
238
-
239
-
240
-
241
-
242
-
243
-
244
-
245
-
246
-
247
-
248
-
249
-
250
-
251
-
252
-
253
-
254
-
255
-
256
-
257
-
258
-
259
-
260
-
261
-
262
-
263
-
264
-
265
-
266
-
267
-
268
-
269
-
270
-
271
-
272
-
273
-
274
-
275
-
276
-
277
-
278
-
279
-
280
-
281
-
282
-
283
-
284
-
285
-
286
-
287
-
288
-
289
-
290
-
291
-
292
-
293
-
294
-
295
-
296
-
297
-
298
-
299
-
300
-
301
-
302
-
303
-
304
-
305
-
306
-
307
-
308
-
309
-
310
-
311
-
312
-
313
-
314
-
315
-
316
-
317
-
318
-
319
-
320
-
321
-
322
-
323
-
324
-
325
-
326
-
327
-
328
-
329
-
330
-
331
-
332
-
333
-
334
-
335
-
336
-
337
-
338
-
339
-
340
-
341
-
342
-
343
-
344
-
345
-
346
-
347
-
348
-
349
-
350
-
351
-
352
-
353
-
354
-
355
-
356
-
357
-
358
-
359
-
360
-
361
-
362
-
363
-
364
-
365
-
366
-
367
-
368
-
369
-
370
-
371
-
372
-
373
-
374
-
375
-
376
-
377
-
378
-
379
-
380
-
381
-
382
-
383
-
384
-
385
-
386
-
387
-
388
-
389
-
390
-
391
-
392
-
393
-
394
-
395
-
396
-
397
-
398
-
399
-
400
-
401
-
402
-
403
-
404
-
405
-
406
-
407
-
408
-
409
-
410
-
411
-
412
-
413
-
414
-
415
-
416
-
417
-
418
-
419
-
420
-
421
-
422
-
423
-
424
-
425
-
426
-
427
-
428
-
429
-
430
-
431
-
432
-
433
-
434
-
435
-
436
-
437
-
438
-
439
-
440
-
441
-
442
-
443
-
444
-
445
-
446
-
447
-
448
-
449
-
450
-
451
-
452
-
453
-
454
-
455
-
456
-
457
-
458
 |
 |

HSBC HOLDINGS PLC
Report of the Directors: Financial Review (continued)
Net insurance claims incurred / Loan impairment charges
136
underwriting of accident and health business resulted
in higher non-life insurance claims reserves.
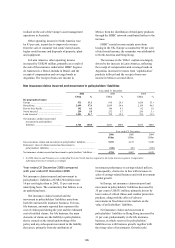
Net insurance claims and movement in
policyholders’ liabilities in North America rose by
12 per cent to US$259 million, mainly reflecting an
increase in reserves for new life insurance business
underwritten in 2006.
In Latin America, higher sales of life and
pension fund products led to an increase in net
insurance claims incurred and movement in
policyholders’ liabilities of 24 per cent to
US$1,023 million. Lower movements in the non-life
insurance liabilities were due to the sale of the non-
life insurance business, HSBC Seguros, in Brazil
during the latter half of 2005.
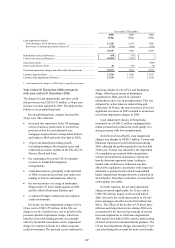
Year ended 31 December 2005 compared
with year ended 31 December 2004
Net insurance claims incurred and movement in
policyholders’ liabilities of US$4,067 million
decreased by 12 per cent compared with 2004. On
an underlying basis, net insurance claims incurred
decreased by 13 per cent.
As with net earned insurance premiums, the
primary reason for the reduction was the required
reclassification under IFRSs in 2005 of
policyholders’ liabilities in respect of long-term
insurance contracts which were reclassified as
‘Liabilities to customers under investment contracts’.
As a consequence, reported net insurance claims
incurred and movement in policyholders’ liabilities
reduced.
The majority of HSBC’s non-life insurance
business largely relates to the provision of personal
insurance products. Minimal impact from hurricane
damage in the US and a lack of significant claims
events during 2005 resulted in a relatively stable
claims experience, augmented by negligible prior-
year reserve development in respect of 2004.
Excluding the effect of the above
reclassification, the most significant reduction in net
claims occurred in Europe, due to the effect of
revised actuarial valuations of existing life insurance
policies in the UK life operation.
The reinsurers’ share of claims incurred and
movement in policyholder liabilities in 2004
included the renegotiation of a reinsurance treaty in
the UK life operation, in which a greater proportion
of risk was transferred to the reinsurer. The
subsequent implementation of a revised liability
valuation system in 2005 reduced the amount of
reserves held for liabilities in respect of income
protection products, bringing additional benefits in
terms of capital efficiency of the UK life operation.
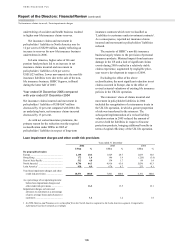
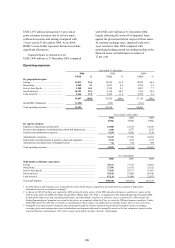
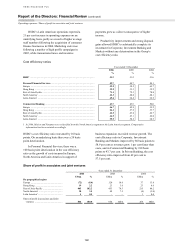
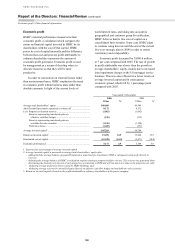
Loan impairment charges and other credit risk provisions
Year ended 31 December
2006 2005 2004
US$m % US$m % US$m %
By geographical region
Europe ...................................................... 2,155 20.4 1,929 24.7 1,033 16.8
Hong Kong .............................................. 172 1.6 146 1.9 (220) (3.6)
Rest of Asia-Pacific ................................. 512 4.8 134 1.7 89 1.4
North America1 ........................................ 6,796 64.3 4,916 63.0 5,036 81.3
Latin America1 ......................................... 938 8.9 676 8.7 253 4.1
Total loan impairment charges and other
credit risk provisions ........................... 10,573 100.0 7,801
100.0 6,191
100.0
As a percentage of net operating income
before loan impairment charges and
other credit risk provisions .................. 16.2
13.5
12.1
Impairment charges on loans and
advances to customers as a percentage
of gross average loans and advances to
customers ............................................. 1.4
1.2
1.4
1 In 2006, Mexico and Panama were reclassified from the North America segment to the Latin America segment. Comparative
information has been restated accordingly.