HSBC 2006 Annual Report Download - page 365
Download and view the complete annual report
Please find page 365 of the 2006 HSBC annual report below. You can navigate through the pages in the report by either clicking on the pages listed below, or by using the keyword search tool below to find specific information within the annual report.-
 1
1 -
2
-
3
-
4
-
5
-
6
-
7
-
8
-
9
-
10
-
11
-
12
-
13
-
14
-
15
-
16
-
17
-
18
-
19
-
20
-
21
-
22
-
23
-
24
-
25
-
26
-
27
-
28
-
29
-
30
-
31
-
32
-
33
-
34
-
35
-
36
-
37
-
38
-
39
-
40
-
41
-
42
-
43
-
44
-
45
-
46
-
47
-
48
-
49
-
50
-
51
-
52
-
53
-
54
-
55
-
56
-
57
-
58
-
59
-
60
-
61
-
62
-
63
-
64
-
65
-
66
-
67
-
68
-
69
-
70
-
71
-
72
-
73
-
74
-
75
-
76
-
77
-
78
-
79
-
80
-
81
-
82
-
83
-
84
-
85
-
86
-
87
-
88
-
89
-
90
-
91
-
92
-
93
-
94
-
95
-
96
-
97
-
98
-
99
-
100
-
101
-
102
-
103
-
104
-
105
-
106
-
107
-
108
-
109
-
110
-
111
-
112
-
113
-
114
-
115
-
116
-
117
-
118
-
119
-
120
-
121
-
122
-
123
-
124
-
125
-
126
-
127
-
128
-
129
-
130
-
131
-
132
-
133
-
134
-
135
-
136
-
137
-
138
-
139
-
140
-
141
-
142
-
143
-
144
-
145
-
146
-
147
-
148
-
149
-
150
-
151
-
152
-
153
-
154
-
155
-
156
-
157
-
158
-
159
-
160
-
161
-
162
-
163
-
164
-
165
-
166
-
167
-
168
-
169
-
170
-
171
-
172
-
173
-
174
-
175
-
176
-
177
-
178
-
179
-
180
-
181
-
182
-
183
-
184
-
185
-
186
-
187
-
188
-
189
-
190
-
191
-
192
-
193
-
194
-
195
-
196
-
197
-
198
-
199
-
200
-
201
-
202
-
203
-
204
-
205
-
206
-
207
-
208
-
209
-
210
-
211
-
212
-
213
-
214
-
215
-
216
-
217
-
218
-
219
-
220
-
221
-
222
-
223
-
224
-
225
-
226
-
227
-
228
-
229
-
230
-
231
-
232
-
233
-
234
-
235
-
236
-
237
-
238
-
239
-
240
-
241
-
242
-
243
-
244
-
245
-
246
-
247
-
248
-
249
-
250
-
251
-
252
-
253
-
254
-
255
-
256
-
257
-
258
-
259
-
260
-
261
-
262
-
263
-
264
-
265
-
266
-
267
-
268
-
269
-
270
-
271
-
272
-
273
-
274
-
275
-
276
-
277
-
278
-
279
-
280
-
281
-
282
-
283
-
284
-
285
-
286
-
287
-
288
-
289
-
290
-
291
-
292
-
293
-
294
-
295
-
296
-
297
-
298
-
299
-
300
-
301
-
302
-
303
-
304
-
305
-
306
-
307
-
308
-
309
-
310
-
311
-
312
-
313
-
314
-
315
-
316
-
317
-
318
-
319
-
320
-
321
-
322
-
323
-
324
-
325
-
326
-
327
-
328
-
329
-
330
-
331
-
332
-
333
-
334
-
335
-
336
-
337
-
338
-
339
-
340
-
341
-
342
-
343
-
344
-
345
-
346
-
347
-
348
-
349
-
350
-
351
-
352
-
353
-
354
-
 355
355 -
 356
356 -
 357
357 -
 358
358 -
 359
359 -
 360
360 -
 361
361 -
 362
362 -
 363
363 -
 364
364 -
 365
365 -
 366
366 -
 367
367 -
 368
368 -
 369
369 -
 370
370 -
 371
371 -
 372
372 -
 373
373 -
 374
374 -
 375
375 -
376
-
377
-
378
-
379
-
380
-
381
-
382
-
383
-
384
-
385
-
386
-
387
-
388
-
389
-
390
-
391
-
392
-
393
-
394
-
395
-
396
-
397
-
398
-
399
-
400
-
401
-
402
-
403
-
404
-
405
-
406
-
407
-
408
-
409
-
410
-
411
-
412
-
413
-
414
-
415
-
416
-
417
-
418
-
419
-
420
-
421
-
422
-
423
-
424
-
425
-
426
-
427
-
428
-
429
-
430
-
431
-
432
-
433
-
434
-
435
-
436
-
437
-
438
-
439
-
440
-
441
-
442
-
443
-
444
-
445
-
446
-
447
-
448
-
449
-
450
-
451
-
452
-
453
-
454
-
455
-
456
-
457
-
458
 |
 |

363
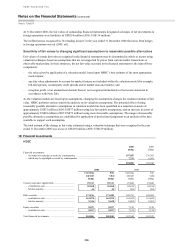
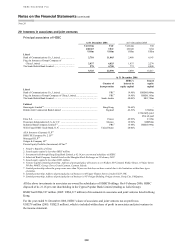
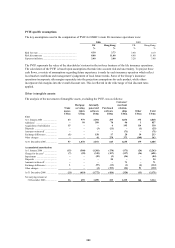
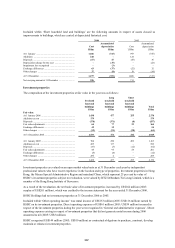
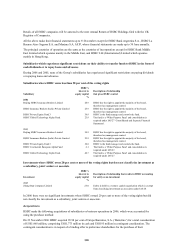
PVIF-specific assumptions
The key assumptions used in the computation of PVIF for HSBC’s main life insurance operations were:
2006 2005
UK Hong Kong UK Hong Kong
% % % %
Risk free rate ................................................................. 4.30 3.73
3.90 4.19
Risk discount rate ......................................................... 8.00 11.00
8.00 11.00
Expenses inflation.......................................................... 3.40 3.00
3.20 3.00
The PVIF represents the value of the shareholder’s interest in the in-force business of the life insurance operations.
The calculation of the PVIF is based upon assumptions that take into account risk and uncertainty. To project these
cash flows, a variety of assumptions regarding future experience is made by each insurance operation which reflect
local market conditions and management’s judgement of local future trends. Some of the Group’s insurance
operations incorporate risk margins separately into the projection assumptions for each product, while others
incorporate risk margins into the overall discount rate. This is reflected in the wide range of risk discount rates
applied.
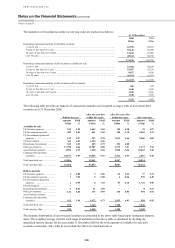
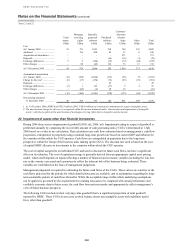
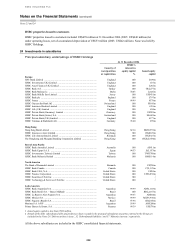
Other intangible assets
The analysis of the movement of intangible assets, excluding the PVIF, was as follows:
Trade
names
Mortgage
servicing
rights
Internally
generated
software
Purchased
software
Customer/
merchant
relation-
ships Other Total
US$m US$m US$m US$m US$m US$m US$m
Cost
At 1 January 2006 ....................... 43 979 2,094 295 1,034 373 4,818
Additions1 ................................... – 99 589 70 96 3 857
Acquisition of subsidiaries ......... 15 – – 6 195 114 330
Disposals ..................................... – – (3) (21) – (1) (25)
Amounts written-off ................... – – – – (71) – (71)
Exchange differences .................. (1) – 150 17 28 39 233
Other changes ............................. – – 41 278 373 (349) 343
At 31 December 2006.................. 57 1,078 2,871 645 1,655 179 6,485
Accumulated amortisation
At 1 January 2006 ....................... (15) (560) (1,301) (170) (173) (24) (2,243)
Charge for the year2 .................... (7) (59) (345) (107) (137) (36) (691)
Impairment .................................. – – (25) (3) (56) – (84)
Disposals ..................................... – – – 20 – – 20
Amounts written-off ................... – – – – 71 – 71
Exchange differences .................. 1 – (97) (13) (1) (4) (114)
Other changes ............................. – – (4) (153) (24) 51 (130)
At 31 December 2006 ................. (21) (619) (1,772) (426) (320) (13) (3,171)
Net carrying amount at
31 December 2006 ..................
36 459
1,099
219
1,335
166
3,314