HSBC 2006 Annual Report Download - page 247
Download and view the complete annual report
Please find page 247 of the 2006 HSBC annual report below. You can navigate through the pages in the report by either clicking on the pages listed below, or by using the keyword search tool below to find specific information within the annual report.-
 1
1 -
2
-
3
-
4
-
5
-
6
-
7
-
8
-
9
-
10
-
11
-
12
-
13
-
14
-
15
-
16
-
17
-
18
-
19
-
20
-
21
-
22
-
23
-
24
-
25
-
26
-
27
-
28
-
29
-
30
-
31
-
32
-
33
-
34
-
35
-
36
-
37
-
38
-
39
-
40
-
41
-
42
-
43
-
44
-
45
-
46
-
47
-
48
-
49
-
50
-
51
-
52
-
53
-
54
-
55
-
56
-
57
-
58
-
59
-
60
-
61
-
62
-
63
-
64
-
65
-
66
-
67
-
68
-
69
-
70
-
71
-
72
-
73
-
74
-
75
-
76
-
77
-
78
-
79
-
80
-
81
-
82
-
83
-
84
-
85
-
86
-
87
-
88
-
89
-
90
-
91
-
92
-
93
-
94
-
95
-
96
-
97
-
98
-
99
-
100
-
101
-
102
-
103
-
104
-
105
-
106
-
107
-
108
-
109
-
110
-
111
-
112
-
113
-
114
-
115
-
116
-
117
-
118
-
119
-
120
-
121
-
122
-
123
-
124
-
125
-
126
-
127
-
128
-
129
-
130
-
131
-
132
-
133
-
134
-
135
-
136
-
137
-
138
-
139
-
140
-
141
-
142
-
143
-
144
-
145
-
146
-
147
-
148
-
149
-
150
-
151
-
152
-
153
-
154
-
155
-
156
-
157
-
158
-
159
-
160
-
161
-
162
-
163
-
164
-
165
-
166
-
167
-
168
-
169
-
170
-
171
-
172
-
173
-
174
-
175
-
176
-
177
-
178
-
179
-
180
-
181
-
182
-
183
-
184
-
185
-
186
-
187
-
188
-
189
-
190
-
191
-
192
-
193
-
194
-
195
-
196
-
197
-
198
-
199
-
200
-
201
-
202
-
203
-
204
-
205
-
206
-
207
-
208
-
209
-
210
-
211
-
212
-
213
-
214
-
215
-
216
-
217
-
218
-
219
-
220
-
221
-
222
-
223
-
224
-
225
-
226
-
227
-
228
-
229
-
230
-
231
-
232
-
233
-
234
-
235
-
236
-
 237
237 -
 238
238 -
 239
239 -
 240
240 -
 241
241 -
 242
242 -
 243
243 -
 244
244 -
 245
245 -
 246
246 -
 247
247 -
 248
248 -
 249
249 -
 250
250 -
 251
251 -
 252
252 -
 253
253 -
 254
254 -
 255
255 -
 256
256 -
 257
257 -
258
-
259
-
260
-
261
-
262
-
263
-
264
-
265
-
266
-
267
-
268
-
269
-
270
-
271
-
272
-
273
-
274
-
275
-
276
-
277
-
278
-
279
-
280
-
281
-
282
-
283
-
284
-
285
-
286
-
287
-
288
-
289
-
290
-
291
-
292
-
293
-
294
-
295
-
296
-
297
-
298
-
299
-
300
-
301
-
302
-
303
-
304
-
305
-
306
-
307
-
308
-
309
-
310
-
311
-
312
-
313
-
314
-
315
-
316
-
317
-
318
-
319
-
320
-
321
-
322
-
323
-
324
-
325
-
326
-
327
-
328
-
329
-
330
-
331
-
332
-
333
-
334
-
335
-
336
-
337
-
338
-
339
-
340
-
341
-
342
-
343
-
344
-
345
-
346
-
347
-
348
-
349
-
350
-
351
-
352
-
353
-
354
-
355
-
356
-
357
-
358
-
359
-
360
-
361
-
362
-
363
-
364
-
365
-
366
-
367
-
368
-
369
-
370
-
371
-
372
-
373
-
374
-
375
-
376
-
377
-
378
-
379
-
380
-
381
-
382
-
383
-
384
-
385
-
386
-
387
-
388
-
389
-
390
-
391
-
392
-
393
-
394
-
395
-
396
-
397
-
398
-
399
-
400
-
401
-
402
-
403
-
404
-
405
-
406
-
407
-
408
-
409
-
410
-
411
-
412
-
413
-
414
-
415
-
416
-
417
-
418
-
419
-
420
-
421
-
422
-
423
-
424
-
425
-
426
-
427
-
428
-
429
-
430
-
431
-
432
-
433
-
434
-
435
-
436
-
437
-
438
-
439
-
440
-
441
-
442
-
443
-
444
-
445
-
446
-
447
-
448
-
449
-
450
-
451
-
452
-
453
-
454
-
455
-
456
-
457
-
458
 |
 |

245
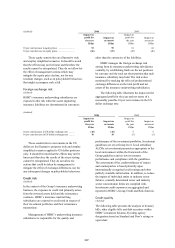
provisions regarding the implementation of capital
requirements calculations mean that, in general,
unless firms notify the FSA to the contrary, they
continue to apply the existing capital requirements
calculations until 1 January 2008. Thereafter, HSBC
proposes to adopt the IRB advanced approach for the
majority of its business. A rollout plan is in place to
extend coverage of the advanced approach over the
succeeding three years, leaving a small residue of
exposures on the standardised approach. For
individual banking subsidiaries, the timing and
manner of implementation of Basel II varies by
jurisdiction and the requirements are set by local
banking supervisors. The application of Basel II
across HSBC’s geographically diverse businesses,
which operate in a large number of different
regulatory environments, represents a significant
logistical and technological challenge, and an
extensive programme of implementation projects is
currently in progress. Basel II permits local
discretion in a number of areas for determination by
local regulators. The extent to which requirements
will diverge, coupled with how the FSA and the
local host regulators in the other countries in which
HSBC operates interact will be key factors in
completing implementation of Basel II. As these
factors emerge, HSBC continues to assess the effect
of Basel II on its capital ratios.
One example of continuing regulatory
uncertainty relates to the US, where banking
supervisory authorities have yet to produce final
rules. They are now expected to be published in
2007. The US authorities have decided to apply the
advanced credit and operational risk methodologies
of Basel II only to the largest US banks and holding
companies, although other banks may decide to opt
in. HSBC North America Holdings Inc. (HSBC’s
highest level US bank holding company in the US,
which holds all HSBC’s major US operating
subsidiaries and HSBC Canada) has been mandated
to comply with these rules. For smaller US banks,
the US banking authorities are considering applying
an updated version of the existing Basel I rules
(dubbed Basel Ia). The Basel Ia rules may also be
used in the determination of Basel II capital floors
during the transition period (2009-11).
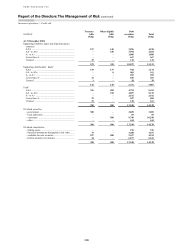
Source and application of tier 1 capital
(Unaudited)
2006
US$m
2005
US$m
Movement in tier 1 capital
At 1 January ......................................................................................................................................... 74,403 67,259
Consolidated profits attributable to shareholders of the parent company .......................................... 15,789 15,081
Dividends ............................................................................................................................................. (8,769) (7,750)
Add back: shares issued in lieu of dividends .................................................................................. 2,525 1,811
Increase in goodwill and intangible assets deducted .......................................................................... (3,668) (1,631)
Preference shares issued ...................................................................................................................... – 1,405
Ordinary shares issued ......................................................................................................................... 1,015 690
Other (including exchange differences) .............................................................................................. 6,547 (2,462)
At 31 December ................................................................................................................................... 87,842 74,403
Movement in risk-weighted assets
At 1 January ......................................................................................................................................... 827,164 759,210
Movements .......................................................................................................................................... 111,514 67,954
At 31 December ................................................................................................................................... 938,678 827,164