HSBC 2006 Annual Report Download - page 341
Download and view the complete annual report
Please find page 341 of the 2006 HSBC annual report below. You can navigate through the pages in the report by either clicking on the pages listed below, or by using the keyword search tool below to find specific information within the annual report.-
 1
1 -
2
-
3
-
4
-
5
-
6
-
7
-
8
-
9
-
10
-
11
-
12
-
13
-
14
-
15
-
16
-
17
-
18
-
19
-
20
-
21
-
22
-
23
-
24
-
25
-
26
-
27
-
28
-
29
-
30
-
31
-
32
-
33
-
34
-
35
-
36
-
37
-
38
-
39
-
40
-
41
-
42
-
43
-
44
-
45
-
46
-
47
-
48
-
49
-
50
-
51
-
52
-
53
-
54
-
55
-
56
-
57
-
58
-
59
-
60
-
61
-
62
-
63
-
64
-
65
-
66
-
67
-
68
-
69
-
70
-
71
-
72
-
73
-
74
-
75
-
76
-
77
-
78
-
79
-
80
-
81
-
82
-
83
-
84
-
85
-
86
-
87
-
88
-
89
-
90
-
91
-
92
-
93
-
94
-
95
-
96
-
97
-
98
-
99
-
100
-
101
-
102
-
103
-
104
-
105
-
106
-
107
-
108
-
109
-
110
-
111
-
112
-
113
-
114
-
115
-
116
-
117
-
118
-
119
-
120
-
121
-
122
-
123
-
124
-
125
-
126
-
127
-
128
-
129
-
130
-
131
-
132
-
133
-
134
-
135
-
136
-
137
-
138
-
139
-
140
-
141
-
142
-
143
-
144
-
145
-
146
-
147
-
148
-
149
-
150
-
151
-
152
-
153
-
154
-
155
-
156
-
157
-
158
-
159
-
160
-
161
-
162
-
163
-
164
-
165
-
166
-
167
-
168
-
169
-
170
-
171
-
172
-
173
-
174
-
175
-
176
-
177
-
178
-
179
-
180
-
181
-
182
-
183
-
184
-
185
-
186
-
187
-
188
-
189
-
190
-
191
-
192
-
193
-
194
-
195
-
196
-
197
-
198
-
199
-
200
-
201
-
202
-
203
-
204
-
205
-
206
-
207
-
208
-
209
-
210
-
211
-
212
-
213
-
214
-
215
-
216
-
217
-
218
-
219
-
220
-
221
-
222
-
223
-
224
-
225
-
226
-
227
-
228
-
229
-
230
-
231
-
232
-
233
-
234
-
235
-
236
-
237
-
238
-
239
-
240
-
241
-
242
-
243
-
244
-
245
-
246
-
247
-
248
-
249
-
250
-
251
-
252
-
253
-
254
-
255
-
256
-
257
-
258
-
259
-
260
-
261
-
262
-
263
-
264
-
265
-
266
-
267
-
268
-
269
-
270
-
271
-
272
-
273
-
274
-
275
-
276
-
277
-
278
-
279
-
280
-
281
-
282
-
283
-
284
-
285
-
286
-
287
-
288
-
289
-
290
-
291
-
292
-
293
-
294
-
295
-
296
-
297
-
298
-
299
-
300
-
301
-
302
-
303
-
304
-
305
-
306
-
307
-
308
-
309
-
310
-
311
-
312
-
313
-
314
-
315
-
316
-
317
-
318
-
319
-
320
-
321
-
322
-
323
-
324
-
325
-
326
-
327
-
328
-
329
-
330
-
 331
331 -
 332
332 -
 333
333 -
 334
334 -
 335
335 -
 336
336 -
 337
337 -
 338
338 -
 339
339 -
 340
340 -
 341
341 -
 342
342 -
 343
343 -
 344
344 -
 345
345 -
 346
346 -
 347
347 -
 348
348 -
 349
349 -
 350
350 -
 351
351 -
352
-
353
-
354
-
355
-
356
-
357
-
358
-
359
-
360
-
361
-
362
-
363
-
364
-
365
-
366
-
367
-
368
-
369
-
370
-
371
-
372
-
373
-
374
-
375
-
376
-
377
-
378
-
379
-
380
-
381
-
382
-
383
-
384
-
385
-
386
-
387
-
388
-
389
-
390
-
391
-
392
-
393
-
394
-
395
-
396
-
397
-
398
-
399
-
400
-
401
-
402
-
403
-
404
-
405
-
406
-
407
-
408
-
409
-
410
-
411
-
412
-
413
-
414
-
415
-
416
-
417
-
418
-
419
-
420
-
421
-
422
-
423
-
424
-
425
-
426
-
427
-
428
-
429
-
430
-
431
-
432
-
433
-
434
-
435
-
436
-
437
-
438
-
439
-
440
-
441
-
442
-
443
-
444
-
445
-
446
-
447
-
448
-
449
-
450
-
451
-
452
-
453
-
454
-
455
-
456
-
457
-
458
 |
 |

339
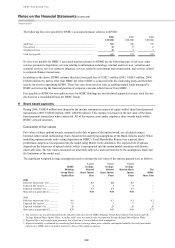
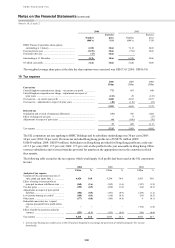
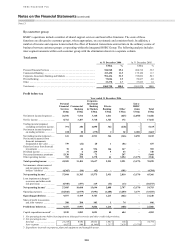
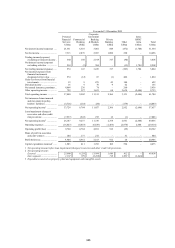
In addition to the amount charged to the income statement, the aggregate amount of current and deferred tax, relating
to items that are taken directly to equity, was a US$44 million reduction in equity (2005: US$437 million; 2004:
US$319 million – both increases in equity).
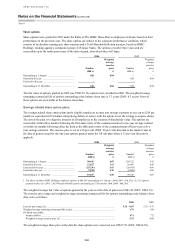
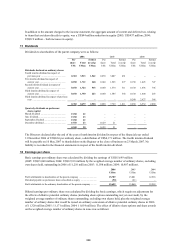
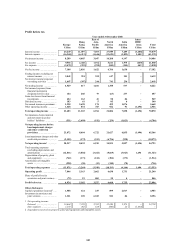
11 Dividends
Dividends to shareholders of the parent company were as follows:
2006 2005 2004
Per
share
US$
Total
US$m
Settled
in scrip
US$m
Per
share
US$
Total
US$m
Settled
in scrip
US$m
Per
share
US$
Total
US$m
Settled
in scrip
US$m
Dividends declared on ordinary shares
Fourth interim dividend in respect of
previous year .......................................... 0.310 3,513 1,542 0.270 3,007 431 – –
–
First interim dividend in respect of
current year ............................................. 0.150 1,712 248 0.140 1,563 677 0.130 1,425
747
Second interim dividend in respect of
current year ............................................. 0.150 1,724 515 0.140 1,574 311 0.130 1,436
746
Third interim dividend in respect of
current year ............................................. 0.150 1,730 223 0.140 1,585 392 0.130 1,444
255
Third interim dividend in respect of previous
year .........................................................
–
– – – – – 0.240 2,627
346
0.760 8,679 2,528 0.690 7,729 1,811 0.630 6,932 2,094
Quarterly dividends on preference
share capital
March dividend ........................................... 15.50 22 – – – –
June dividend............................................... 15.50 23 – – – –
September dividend ..................................... 15.50 22 – – – –
December dividend...................................... 15.50 23 14.29 21 – –
62.00 90 14.29 21 – –
The Directors declared after the end of the year a fourth interim dividend in respect of the financial year ended
31 December 2006 of US$0.36 per ordinary share, a distribution of US$4,171 million. The fourth interim dividend
will be payable on 10 May 2007 to shareholders on the Register at the close of business on 23 March 2007. No
liability is recorded in the financial statements in respect of the fourth interim dividend.
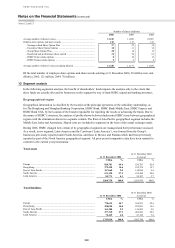
12 Earnings per share
Basic earnings per ordinary share was calculated by dividing the earnings of US$15,699 million
(2005: US$15,060 million; 2004: US$12,918 million) by the weighted average number of ordinary shares, excluding
own shares held, outstanding in 2006 of 11,210 million (2005: 11,038 million; 2004: 10,907 million).
2006 2005 2004
US$m US$m US$m
Profit attributable to shareholders of the parent company .............................. 15,789 15,081 12,918
Dividend payable on preference shares classified as equity ........................... (90) (21) –
Profit attributable to the ordinary shareholders of the parent company .......... 15,699 15,060 12,918
Diluted earnings per ordinary share was calculated by dividing the basic earnings, which require no adjustment for
the effects of dilutive potential ordinary shares (including share options outstanding not yet exercised), by the
weighted average number of ordinary shares outstanding, excluding own shares held, plus the weighted average
number of ordinary shares that would be issued on ordinary conversion of dilutive potential ordinary shares in 2006
of 11,320 million (2005: 11,171 million; 2004: 11,054 million). The effect of dilutive share options and share awards
on the weighted average number of ordinary shares in issue was as follows: