HSBC 2006 Annual Report Download - page 236
Download and view the complete annual report
Please find page 236 of the 2006 HSBC annual report below. You can navigate through the pages in the report by either clicking on the pages listed below, or by using the keyword search tool below to find specific information within the annual report.-
 1
1 -
2
-
3
-
4
-
5
-
6
-
7
-
8
-
9
-
10
-
11
-
12
-
13
-
14
-
15
-
16
-
17
-
18
-
19
-
20
-
21
-
22
-
23
-
24
-
25
-
26
-
27
-
28
-
29
-
30
-
31
-
32
-
33
-
34
-
35
-
36
-
37
-
38
-
39
-
40
-
41
-
42
-
43
-
44
-
45
-
46
-
47
-
48
-
49
-
50
-
51
-
52
-
53
-
54
-
55
-
56
-
57
-
58
-
59
-
60
-
61
-
62
-
63
-
64
-
65
-
66
-
67
-
68
-
69
-
70
-
71
-
72
-
73
-
74
-
75
-
76
-
77
-
78
-
79
-
80
-
81
-
82
-
83
-
84
-
85
-
86
-
87
-
88
-
89
-
90
-
91
-
92
-
93
-
94
-
95
-
96
-
97
-
98
-
99
-
100
-
101
-
102
-
103
-
104
-
105
-
106
-
107
-
108
-
109
-
110
-
111
-
112
-
113
-
114
-
115
-
116
-
117
-
118
-
119
-
120
-
121
-
122
-
123
-
124
-
125
-
126
-
127
-
128
-
129
-
130
-
131
-
132
-
133
-
134
-
135
-
136
-
137
-
138
-
139
-
140
-
141
-
142
-
143
-
144
-
145
-
146
-
147
-
148
-
149
-
150
-
151
-
152
-
153
-
154
-
155
-
156
-
157
-
158
-
159
-
160
-
161
-
162
-
163
-
164
-
165
-
166
-
167
-
168
-
169
-
170
-
171
-
172
-
173
-
174
-
175
-
176
-
177
-
178
-
179
-
180
-
181
-
182
-
183
-
184
-
185
-
186
-
187
-
188
-
189
-
190
-
191
-
192
-
193
-
194
-
195
-
196
-
197
-
198
-
199
-
200
-
201
-
202
-
203
-
204
-
205
-
206
-
207
-
208
-
209
-
210
-
211
-
212
-
213
-
214
-
215
-
216
-
217
-
218
-
219
-
220
-
221
-
222
-
223
-
224
-
225
-
 226
226 -
 227
227 -
 228
228 -
 229
229 -
 230
230 -
 231
231 -
 232
232 -
 233
233 -
 234
234 -
 235
235 -
 236
236 -
 237
237 -
 238
238 -
 239
239 -
 240
240 -
 241
241 -
 242
242 -
 243
243 -
 244
244 -
 245
245 -
 246
246 -
247
-
248
-
249
-
250
-
251
-
252
-
253
-
254
-
255
-
256
-
257
-
258
-
259
-
260
-
261
-
262
-
263
-
264
-
265
-
266
-
267
-
268
-
269
-
270
-
271
-
272
-
273
-
274
-
275
-
276
-
277
-
278
-
279
-
280
-
281
-
282
-
283
-
284
-
285
-
286
-
287
-
288
-
289
-
290
-
291
-
292
-
293
-
294
-
295
-
296
-
297
-
298
-
299
-
300
-
301
-
302
-
303
-
304
-
305
-
306
-
307
-
308
-
309
-
310
-
311
-
312
-
313
-
314
-
315
-
316
-
317
-
318
-
319
-
320
-
321
-
322
-
323
-
324
-
325
-
326
-
327
-
328
-
329
-
330
-
331
-
332
-
333
-
334
-
335
-
336
-
337
-
338
-
339
-
340
-
341
-
342
-
343
-
344
-
345
-
346
-
347
-
348
-
349
-
350
-
351
-
352
-
353
-
354
-
355
-
356
-
357
-
358
-
359
-
360
-
361
-
362
-
363
-
364
-
365
-
366
-
367
-
368
-
369
-
370
-
371
-
372
-
373
-
374
-
375
-
376
-
377
-
378
-
379
-
380
-
381
-
382
-
383
-
384
-
385
-
386
-
387
-
388
-
389
-
390
-
391
-
392
-
393
-
394
-
395
-
396
-
397
-
398
-
399
-
400
-
401
-
402
-
403
-
404
-
405
-
406
-
407
-
408
-
409
-
410
-
411
-
412
-
413
-
414
-
415
-
416
-
417
-
418
-
419
-
420
-
421
-
422
-
423
-
424
-
425
-
426
-
427
-
428
-
429
-
430
-
431
-
432
-
433
-
434
-
435
-
436
-
437
-
438
-
439
-
440
-
441
-
442
-
443
-
444
-
445
-
446
-
447
-
448
-
449
-
450
-
451
-
452
-
453
-
454
-
455
-
456
-
457
-
458
 |
 |

HSBC HOLDINGS PLC
Report of the Directors: The Management of Risk (continued)
Insurance operations > Financial risks / Market risk
234
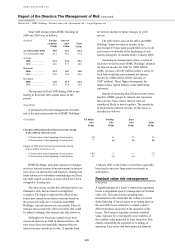
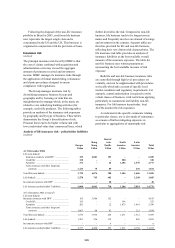
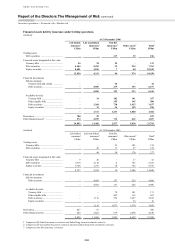
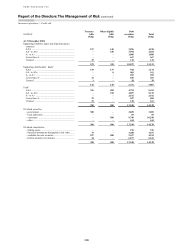
Financial assets held by insurance underwriting operations
(Audited)
At 31 December 2006
Life linked Life non-linked Non-life
insurance1 insurance2 insurance3 Other assets4 Total5
US$m US$m US$m US$m US$m
Trading assets
Debt securities ...................................... – – 117 39 156
Financial assets designated at fair value
Treasury bills ........................................ 54 24 55 – 133
Debt securities ...................................... 4,304 2,492 32 934 7,762
Equity securities ................................... 8,681 1,815 7 40 10,543
13,039 4,331 94 974 18,438
Financial investments
Held-to-maturity:
Treasury bills and similar ................ – – 44 – 44
Debt securities .................................. – 5,585 279 333 6,197
– 5,585 323 333 6,241
Available-for-sale:
Treasury bills .................................... – 14 102 141 257
Other eligible bills ............................ – – 355 145 500
Debt securities .................................. – 1,284 738 1,415 3,437
Equity securities ............................... – 13 36 139 188
– 1,311 1,231 1,840 4,382
Derivatives................................................. 780 99 – – 879
Other financial assets6 .............................. 274 2,079 712 632 3,697
14,093 13,405 2,477 3,818 33,793
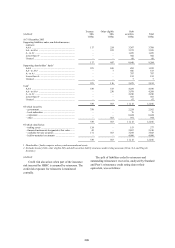
(Audited) At 31 December 2005
Life linked Life non-linked Non-life
insurance1 insurance2 insurance3 Other assets4 Total5
US$m US$m US$m US$m US$m
Trading assets
Treasury bills......................................... – – 21 103 124
Debt securities ...................................... – 49 37 67 153
– 49 58 170 277
Financial assets designated at fair value
Treasury bills ........................................ 9 26 – 17 52
Debt securities ...................................... 2,374 2,118 4 745 5,241
Equity securities ................................... 6,744 1,275 10 726 8,755
9,127 3,419 14 1,488 14,048
Financial investments
Held-to-maturity:
Debt securities .................................. – 4,603 157 226 4,986
– 4,603 157 226 4,986
Available-for-sale:
Treasury bills .................................... – – 70 101 171
Other eligible bills ............................ – – 447 116 563
Debt securities .................................. – 1,116 556 1,437 3,109
Equity securities ............................... – – – 16 16
– 1,116 1,073 1,670 3,859
Derivatives................................................. 427 61 – – 488
Other financial assets ................................ 442 2,021 619 1,098 4,180
9,996 11,269 1,921 4,652 27,838
1 Comprises life linked insurance contracts and linked long-term investment contracts.
2 Comprises life non-linked insurance contracts and non-linked long-term investment contracts.
3 Comprises non-life insurance contracts.