HSBC 2006 Annual Report Download - page 194
Download and view the complete annual report
Please find page 194 of the 2006 HSBC annual report below. You can navigate through the pages in the report by either clicking on the pages listed below, or by using the keyword search tool below to find specific information within the annual report.-
 1
1 -
2
-
3
-
4
-
5
-
6
-
7
-
8
-
9
-
10
-
11
-
12
-
13
-
14
-
15
-
16
-
17
-
18
-
19
-
20
-
21
-
22
-
23
-
24
-
25
-
26
-
27
-
28
-
29
-
30
-
31
-
32
-
33
-
34
-
35
-
36
-
37
-
38
-
39
-
40
-
41
-
42
-
43
-
44
-
45
-
46
-
47
-
48
-
49
-
50
-
51
-
52
-
53
-
54
-
55
-
56
-
57
-
58
-
59
-
60
-
61
-
62
-
63
-
64
-
65
-
66
-
67
-
68
-
69
-
70
-
71
-
72
-
73
-
74
-
75
-
76
-
77
-
78
-
79
-
80
-
81
-
82
-
83
-
84
-
85
-
86
-
87
-
88
-
89
-
90
-
91
-
92
-
93
-
94
-
95
-
96
-
97
-
98
-
99
-
100
-
101
-
102
-
103
-
104
-
105
-
106
-
107
-
108
-
109
-
110
-
111
-
112
-
113
-
114
-
115
-
116
-
117
-
118
-
119
-
120
-
121
-
122
-
123
-
124
-
125
-
126
-
127
-
128
-
129
-
130
-
131
-
132
-
133
-
134
-
135
-
136
-
137
-
138
-
139
-
140
-
141
-
142
-
143
-
144
-
145
-
146
-
147
-
148
-
149
-
150
-
151
-
152
-
153
-
154
-
155
-
156
-
157
-
158
-
159
-
160
-
161
-
162
-
163
-
164
-
165
-
166
-
167
-
168
-
169
-
170
-
171
-
172
-
173
-
174
-
175
-
176
-
177
-
178
-
179
-
180
-
181
-
182
-
183
-
 184
184 -
 185
185 -
 186
186 -
 187
187 -
 188
188 -
 189
189 -
 190
190 -
 191
191 -
 192
192 -
 193
193 -
 194
194 -
 195
195 -
 196
196 -
 197
197 -
 198
198 -
 199
199 -
 200
200 -
 201
201 -
 202
202 -
 203
203 -
 204
204 -
205
-
206
-
207
-
208
-
209
-
210
-
211
-
212
-
213
-
214
-
215
-
216
-
217
-
218
-
219
-
220
-
221
-
222
-
223
-
224
-
225
-
226
-
227
-
228
-
229
-
230
-
231
-
232
-
233
-
234
-
235
-
236
-
237
-
238
-
239
-
240
-
241
-
242
-
243
-
244
-
245
-
246
-
247
-
248
-
249
-
250
-
251
-
252
-
253
-
254
-
255
-
256
-
257
-
258
-
259
-
260
-
261
-
262
-
263
-
264
-
265
-
266
-
267
-
268
-
269
-
270
-
271
-
272
-
273
-
274
-
275
-
276
-
277
-
278
-
279
-
280
-
281
-
282
-
283
-
284
-
285
-
286
-
287
-
288
-
289
-
290
-
291
-
292
-
293
-
294
-
295
-
296
-
297
-
298
-
299
-
300
-
301
-
302
-
303
-
304
-
305
-
306
-
307
-
308
-
309
-
310
-
311
-
312
-
313
-
314
-
315
-
316
-
317
-
318
-
319
-
320
-
321
-
322
-
323
-
324
-
325
-
326
-
327
-
328
-
329
-
330
-
331
-
332
-
333
-
334
-
335
-
336
-
337
-
338
-
339
-
340
-
341
-
342
-
343
-
344
-
345
-
346
-
347
-
348
-
349
-
350
-
351
-
352
-
353
-
354
-
355
-
356
-
357
-
358
-
359
-
360
-
361
-
362
-
363
-
364
-
365
-
366
-
367
-
368
-
369
-
370
-
371
-
372
-
373
-
374
-
375
-
376
-
377
-
378
-
379
-
380
-
381
-
382
-
383
-
384
-
385
-
386
-
387
-
388
-
389
-
390
-
391
-
392
-
393
-
394
-
395
-
396
-
397
-
398
-
399
-
400
-
401
-
402
-
403
-
404
-
405
-
406
-
407
-
408
-
409
-
410
-
411
-
412
-
413
-
414
-
415
-
416
-
417
-
418
-
419
-
420
-
421
-
422
-
423
-
424
-
425
-
426
-
427
-
428
-
429
-
430
-
431
-
432
-
433
-
434
-
435
-
436
-
437
-
438
-
439
-
440
-
441
-
442
-
443
-
444
-
445
-
446
-
447
-
448
-
449
-
450
-
451
-
452
-
453
-
454
-
455
-
456
-
457
-
458
 |
 |

HSBC HOLDINGS PLC
Report of the Directors: The Management of Risk (continued)
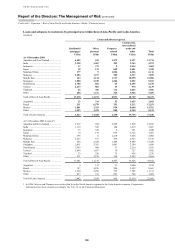
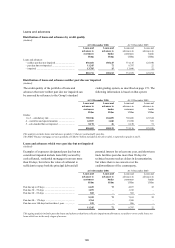
Credit risk > Exposure / Credit quality > Loans and advances
192
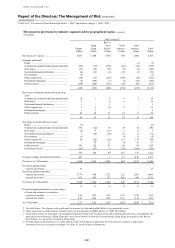
outstandings comprise loans and advances
(excluding settlement accounts), amounts receivable
under finance leases, acceptances, commercial bills,
certificates of deposit, and debt and equity securities
(net of short positions), and exclude accrued interest
and intra-HSBC exposures.
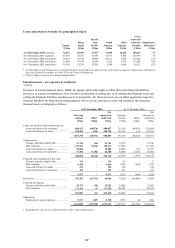
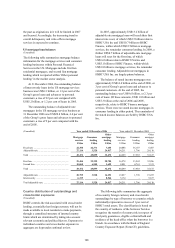
In-country foreign currency and cross-border outstandings
(Unaudited)
Banks
Government
and official
institutions Other Total
US$bn US$bn US$bn US$bn
At 31 December 2006
UK ................................................................................... 24.8 – 33.5 58.3
Germany ......................................................................... 23.7 18.9 2.0 44.6
US ................................................................................... 9.5 12.7 16.2 38.4
France ............................................................................. 22.1 2.4 6.1 30.6
The Netherlands .............................................................. 14.4 2.1 3.9 20.4
Italy ................................................................................. 4.7 12.5 1.4 18.6
At 31 December 2005
UK ................................................................................... 19.6 3.7 16.2 39.5
US ................................................................................... 10.2 11.1 17.1 38.4
Germany ......................................................................... 21.6 12.7 3.3 37.6
France ............................................................................. 11.5 4.7 5.4 21.6
The Netherlands .............................................................. 11.9 2.6 4.4 18.9
Italy ................................................................................. 4.4 10.6 3.5 18.5
At 31 December 2004
UK ................................................................................... 19.7 3.8 24.5 48.0
US ................................................................................... 9.2 13.3 14.0 36.5
Germany ......................................................................... 17.8 10.4 4.0 32.2
France ............................................................................. 11.1 3.7 4.6 19.4
Italy ................................................................................. 5.7 9.7 2.1 17.5
The Netherlands .............................................................. 9.1 2.2 4.2 15.5
Hong Kong ..................................................................... 1.6 1.1 10.3 13.0
At 31 December 2006, HSBC had in-country foreign
currency and cross-border outstandings to
counterparties in Australia and Hong Kong of
between 0.75 per cent and 1 per cent of total assets.
The aggregate in-country foreign currency and cross-
border outstandings were Australia: US$17.5 billion;
Hong Kong: US$15.5 billion.
At 31 December 2005, HSBC had in-country
foreign currency and cross-border outstandings to
counterparties in Hong Kong, Australia and Canada
of between 0.75 per cent and 1 per cent of total
assets. The aggregate in-country foreign currency
and cross-border outstandings were Hong Kong:
US$14.6 billion; Australia: US$12.5 billion; Canada:
US$11.7 billion.
At 31 December 2004, HSBC had in-country
foreign currency and cross-border outstandings to
counterparties in Australia and Canada of between
0.75 per cent and 1 per cent of total assets. The
aggregate in-country foreign currency and cross-
border outstandings were Australia: US$12.7 billion;
Canada: US$11.8 billion.
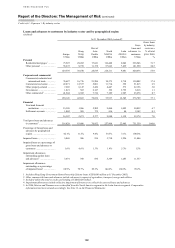
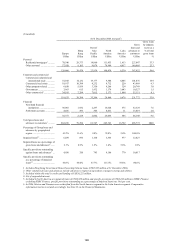
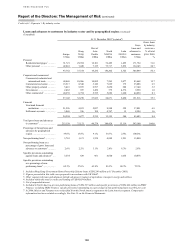
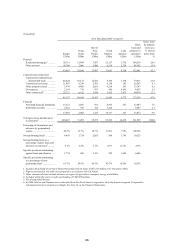
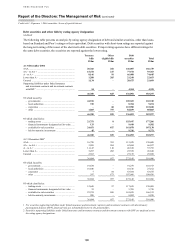
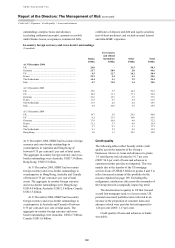
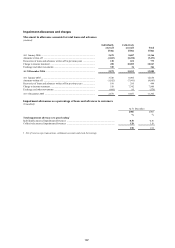
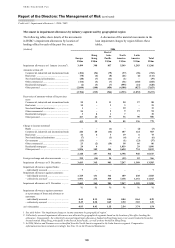
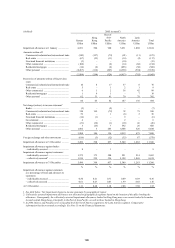
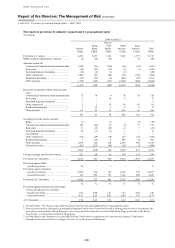
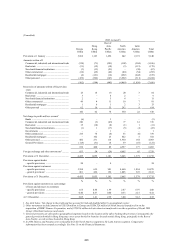
Credit quality
The following tables reflect broadly stable credit
quality across the majority of the Group’s
businesses. However, loans and advances in grades
1-3 (satisfactory risk) declined to 91.7 per cent
(2005: 96.4 per cent) of loans and advances to
customers neither past due nor impaired. This was
mainly due to the transfer of the US mortgage
services book of US$44.5 billion to grades 4 and 5 to
reflect increased scrutiny of this portfolio for the
reasons explained on page 189. Excluding this
realignment, satisfactory risk across the remainder of
the Group showed a marginally improving trend.
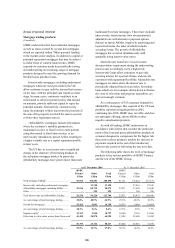
The deterioration in quality in US first lien and
second lien mortgages (and, to a lesser extent, UK
personal unsecured portfolios) also reflected in an
increase in the proportion of customer loans and
advances which were past due but not impaired to
1.28 per cent (2005: 1.17 per cent).
Credit quality of loans and advances to banks
was stable.