HSBC 2006 Annual Report Download - page 216
Download and view the complete annual report
Please find page 216 of the 2006 HSBC annual report below. You can navigate through the pages in the report by either clicking on the pages listed below, or by using the keyword search tool below to find specific information within the annual report.-
 1
1 -
2
-
3
-
4
-
5
-
6
-
7
-
8
-
9
-
10
-
11
-
12
-
13
-
14
-
15
-
16
-
17
-
18
-
19
-
20
-
21
-
22
-
23
-
24
-
25
-
26
-
27
-
28
-
29
-
30
-
31
-
32
-
33
-
34
-
35
-
36
-
37
-
38
-
39
-
40
-
41
-
42
-
43
-
44
-
45
-
46
-
47
-
48
-
49
-
50
-
51
-
52
-
53
-
54
-
55
-
56
-
57
-
58
-
59
-
60
-
61
-
62
-
63
-
64
-
65
-
66
-
67
-
68
-
69
-
70
-
71
-
72
-
73
-
74
-
75
-
76
-
77
-
78
-
79
-
80
-
81
-
82
-
83
-
84
-
85
-
86
-
87
-
88
-
89
-
90
-
91
-
92
-
93
-
94
-
95
-
96
-
97
-
98
-
99
-
100
-
101
-
102
-
103
-
104
-
105
-
106
-
107
-
108
-
109
-
110
-
111
-
112
-
113
-
114
-
115
-
116
-
117
-
118
-
119
-
120
-
121
-
122
-
123
-
124
-
125
-
126
-
127
-
128
-
129
-
130
-
131
-
132
-
133
-
134
-
135
-
136
-
137
-
138
-
139
-
140
-
141
-
142
-
143
-
144
-
145
-
146
-
147
-
148
-
149
-
150
-
151
-
152
-
153
-
154
-
155
-
156
-
157
-
158
-
159
-
160
-
161
-
162
-
163
-
164
-
165
-
166
-
167
-
168
-
169
-
170
-
171
-
172
-
173
-
174
-
175
-
176
-
177
-
178
-
179
-
180
-
181
-
182
-
183
-
184
-
185
-
186
-
187
-
188
-
189
-
190
-
191
-
192
-
193
-
194
-
195
-
196
-
197
-
198
-
199
-
200
-
201
-
202
-
203
-
204
-
205
-
 206
206 -
 207
207 -
 208
208 -
 209
209 -
 210
210 -
 211
211 -
 212
212 -
 213
213 -
 214
214 -
 215
215 -
 216
216 -
 217
217 -
 218
218 -
 219
219 -
 220
220 -
 221
221 -
 222
222 -
 223
223 -
 224
224 -
 225
225 -
 226
226 -
227
-
228
-
229
-
230
-
231
-
232
-
233
-
234
-
235
-
236
-
237
-
238
-
239
-
240
-
241
-
242
-
243
-
244
-
245
-
246
-
247
-
248
-
249
-
250
-
251
-
252
-
253
-
254
-
255
-
256
-
257
-
258
-
259
-
260
-
261
-
262
-
263
-
264
-
265
-
266
-
267
-
268
-
269
-
270
-
271
-
272
-
273
-
274
-
275
-
276
-
277
-
278
-
279
-
280
-
281
-
282
-
283
-
284
-
285
-
286
-
287
-
288
-
289
-
290
-
291
-
292
-
293
-
294
-
295
-
296
-
297
-
298
-
299
-
300
-
301
-
302
-
303
-
304
-
305
-
306
-
307
-
308
-
309
-
310
-
311
-
312
-
313
-
314
-
315
-
316
-
317
-
318
-
319
-
320
-
321
-
322
-
323
-
324
-
325
-
326
-
327
-
328
-
329
-
330
-
331
-
332
-
333
-
334
-
335
-
336
-
337
-
338
-
339
-
340
-
341
-
342
-
343
-
344
-
345
-
346
-
347
-
348
-
349
-
350
-
351
-
352
-
353
-
354
-
355
-
356
-
357
-
358
-
359
-
360
-
361
-
362
-
363
-
364
-
365
-
366
-
367
-
368
-
369
-
370
-
371
-
372
-
373
-
374
-
375
-
376
-
377
-
378
-
379
-
380
-
381
-
382
-
383
-
384
-
385
-
386
-
387
-
388
-
389
-
390
-
391
-
392
-
393
-
394
-
395
-
396
-
397
-
398
-
399
-
400
-
401
-
402
-
403
-
404
-
405
-
406
-
407
-
408
-
409
-
410
-
411
-
412
-
413
-
414
-
415
-
416
-
417
-
418
-
419
-
420
-
421
-
422
-
423
-
424
-
425
-
426
-
427
-
428
-
429
-
430
-
431
-
432
-
433
-
434
-
435
-
436
-
437
-
438
-
439
-
440
-
441
-
442
-
443
-
444
-
445
-
446
-
447
-
448
-
449
-
450
-
451
-
452
-
453
-
454
-
455
-
456
-
457
-
458
 |
 |

HSBC HOLDINGS PLC
Report of the Directors: The Management of Risk (continued)
Liquidity and funding > Primary sources of funding / HSBC Holdings
214
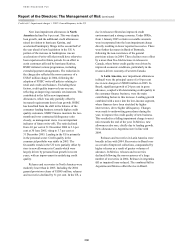
range of products, maturities and currencies to avoid
undue reliance on any particular funding source.
Of total liabilities of US$1,746 billion at
31 December 2006 (2005: US$1,404 billion),
funding from customers amounted to US$911 billion
(2005: US$810 billion), of which US$872 billion
(2005: US$773 billion) was contractually repayable
within one year. However, although the contractual
repayments of many customer accounts are on
demand or at short notice, in practice short-term
deposit balances remain stable as inflows and
outflows broadly match.
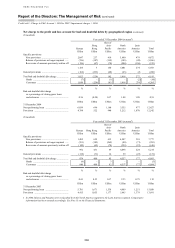
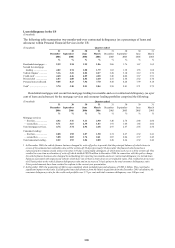
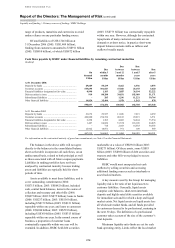
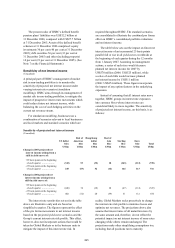
Cash flows payable by HSBC under financial liabilities by remaining contractual maturities
(Audited)
On
demand
US$m
Due
within 3
months
US$m
Due
between
3 and 12
months
US$m
Due
between
1 and 5
years
US$m
Due
after 5
years
US$m
At 31 December 2006
Deposits by banks ......................................................... 29,609 55,239 8,462 6,356 4,893
Customer accounts ........................................................ 535,695 301,847 47,560 25,155 5,420
Financial liabilities designated at fair value ................. 8,990 1,103 2,855 36,194 52,222
Debt securities in issue ................................................. 919 80,288 38,831 102,069 51,171
Subordinated liabilities ................................................. – 285 1,296 11,221 30,764
Other financial liabilities .............................................. 14,824 35,494 1,978 1,543 878
590,037 474,256 100,982 182,538 145,348
At 31 December 2005
Deposits by banks ......................................................... 21,672 29,937 11,026 7,619 4,259
Customer accounts ........................................................ 424,880 254,354 40,813 29,619 6,531
Financial liabilities designated at fair value ................. 6,258 1,365 4,603 34,244 73,534
Debt securities in issue ................................................. 1,487 64,824 51,538 118,109 24,823
Subordinated liabilities ................................................. – 714 2,453 14,583 30,555
Other financial liabilities .............................................. 12,922 14,871 971 109 689
467,219 366,065 111,404 204,283 140,391
For information on the contractual maturity of gross loan commitments, see Note 41 on the Financial Statements.
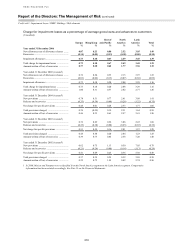
The balances in the above table will not agree
directly to the balances in the consolidated balance
sheet as the table incorporates all cash flows, on an
undiscounted basis, related to both principal as well
as those associated with all future coupon payments.
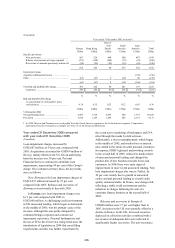
Liabilities in trading portfolios have not been
analysed by contractual maturity because trading
assets and liabilities are typically held for short
periods of time.
Assets available to meet these liabilities, and to
cover outstanding commitments (2006:
US$715 billion; 2005: US$642 billion), included
cash, central bank balances, items in the course of
collection and treasury and other bills (2006:
US$87 billion; 2005: US$75 billion); loans to banks
(2006: US$237 billion; 2005: US$156 billion),
including US$179 billion (2005: US$121 billion)
repayable within one year; and loans to customers
(2006: US$940 billion; 2005: US$793 billion),
including US$360 billion (2005: US$313 billion)
repayable within one year. In the normal course of
business, a proportion of customer loans
contractually repayable within one year will be
extended. In addition, HSBC held debt securities
marketable at a value of US$336 billion (2005:
US$273 billion). Of these assets, some US$93
billion (2005: US$98 billion) of debt securities and
treasury and other bills were pledged to secure
liabilities.
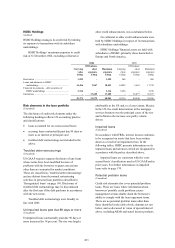
HSBC would meet unexpected net cash
outflows by selling securities and accessing
additional funding sources such as interbank or
asset-backed markets.
A key measure used by the Group for managing
liquidity risk is the ratio of net liquid assets to
customer liabilities. Generally, liquid assets
comprise cash balances, short-term interbank
deposits and highly-rated debt securities available
for immediate sale and for which a deep and liquid
market exists. Net liquid assets are liquid assets less
all wholesale market funds, and all funds provided
by customers deemed to be professional, maturing in
the next 30 days. The definition of a professional
customer takes account of the size of the customer’s
total deposits.
Minimum liquidity ratio limits are set for each
bank operating entity. Limits reflect the local market