HSBC 2006 Annual Report Download - page 141
Download and view the complete annual report
Please find page 141 of the 2006 HSBC annual report below. You can navigate through the pages in the report by either clicking on the pages listed below, or by using the keyword search tool below to find specific information within the annual report.-
 1
1 -
2
-
3
-
4
-
5
-
6
-
7
-
8
-
9
-
10
-
11
-
12
-
13
-
14
-
15
-
16
-
17
-
18
-
19
-
20
-
21
-
22
-
23
-
24
-
25
-
26
-
27
-
28
-
29
-
30
-
31
-
32
-
33
-
34
-
35
-
36
-
37
-
38
-
39
-
40
-
41
-
42
-
43
-
44
-
45
-
46
-
47
-
48
-
49
-
50
-
51
-
52
-
53
-
54
-
55
-
56
-
57
-
58
-
59
-
60
-
61
-
62
-
63
-
64
-
65
-
66
-
67
-
68
-
69
-
70
-
71
-
72
-
73
-
74
-
75
-
76
-
77
-
78
-
79
-
80
-
81
-
82
-
83
-
84
-
85
-
86
-
87
-
88
-
89
-
90
-
91
-
92
-
93
-
94
-
95
-
96
-
97
-
98
-
99
-
100
-
101
-
102
-
103
-
104
-
105
-
106
-
107
-
108
-
109
-
110
-
111
-
112
-
113
-
114
-
115
-
116
-
117
-
118
-
119
-
120
-
121
-
122
-
123
-
124
-
125
-
126
-
127
-
128
-
129
-
130
-
 131
131 -
 132
132 -
 133
133 -
 134
134 -
 135
135 -
 136
136 -
 137
137 -
 138
138 -
 139
139 -
 140
140 -
 141
141 -
 142
142 -
 143
143 -
 144
144 -
 145
145 -
 146
146 -
 147
147 -
 148
148 -
 149
149 -
 150
150 -
 151
151 -
152
-
153
-
154
-
155
-
156
-
157
-
158
-
159
-
160
-
161
-
162
-
163
-
164
-
165
-
166
-
167
-
168
-
169
-
170
-
171
-
172
-
173
-
174
-
175
-
176
-
177
-
178
-
179
-
180
-
181
-
182
-
183
-
184
-
185
-
186
-
187
-
188
-
189
-
190
-
191
-
192
-
193
-
194
-
195
-
196
-
197
-
198
-
199
-
200
-
201
-
202
-
203
-
204
-
205
-
206
-
207
-
208
-
209
-
210
-
211
-
212
-
213
-
214
-
215
-
216
-
217
-
218
-
219
-
220
-
221
-
222
-
223
-
224
-
225
-
226
-
227
-
228
-
229
-
230
-
231
-
232
-
233
-
234
-
235
-
236
-
237
-
238
-
239
-
240
-
241
-
242
-
243
-
244
-
245
-
246
-
247
-
248
-
249
-
250
-
251
-
252
-
253
-
254
-
255
-
256
-
257
-
258
-
259
-
260
-
261
-
262
-
263
-
264
-
265
-
266
-
267
-
268
-
269
-
270
-
271
-
272
-
273
-
274
-
275
-
276
-
277
-
278
-
279
-
280
-
281
-
282
-
283
-
284
-
285
-
286
-
287
-
288
-
289
-
290
-
291
-
292
-
293
-
294
-
295
-
296
-
297
-
298
-
299
-
300
-
301
-
302
-
303
-
304
-
305
-
306
-
307
-
308
-
309
-
310
-
311
-
312
-
313
-
314
-
315
-
316
-
317
-
318
-
319
-
320
-
321
-
322
-
323
-
324
-
325
-
326
-
327
-
328
-
329
-
330
-
331
-
332
-
333
-
334
-
335
-
336
-
337
-
338
-
339
-
340
-
341
-
342
-
343
-
344
-
345
-
346
-
347
-
348
-
349
-
350
-
351
-
352
-
353
-
354
-
355
-
356
-
357
-
358
-
359
-
360
-
361
-
362
-
363
-
364
-
365
-
366
-
367
-
368
-
369
-
370
-
371
-
372
-
373
-
374
-
375
-
376
-
377
-
378
-
379
-
380
-
381
-
382
-
383
-
384
-
385
-
386
-
387
-
388
-
389
-
390
-
391
-
392
-
393
-
394
-
395
-
396
-
397
-
398
-
399
-
400
-
401
-
402
-
403
-
404
-
405
-
406
-
407
-
408
-
409
-
410
-
411
-
412
-
413
-
414
-
415
-
416
-
417
-
418
-
419
-
420
-
421
-
422
-
423
-
424
-
425
-
426
-
427
-
428
-
429
-
430
-
431
-
432
-
433
-
434
-
435
-
436
-
437
-
438
-
439
-
440
-
441
-
442
-
443
-
444
-
445
-
446
-
447
-
448
-
449
-
450
-
451
-
452
-
453
-
454
-
455
-
456
-
457
-
458
 |
 |

139
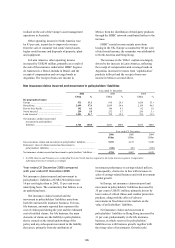
US$11,357 million represented 1.5 per cent of
gross customer advances (net of reverse repos,
settlement accounts and netting) compared with
2.0 per cent at 31 December 2004. As in 2004,
HSBC’s cross-border exposures did not necessitate
significant allowances.
Impaired loans to customers were
US$11,446 million at 31 December 2005 compared
with US$12,427 million at 31 December 2004,
largely reflecting the write-off of impaired loans
against the provisions held in respect of these loans.
At constant exchange rates, impaired loans were
3 per cent lower than 2004 compared with
underlying lending growth (excluding lending to the
financial sector and settlement accounts) of
12 per cent.
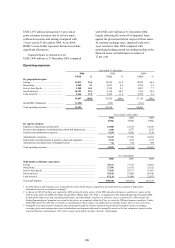
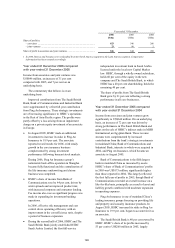
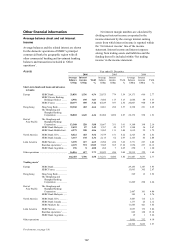
Operating expenses
Year ended 31 December
2006 2005 2004
US$m % US$m % US$m %
By geographical region
Europe ...................................................... 13,871 39.6 12,639 41.4 12,028 44.4
Hong Kong .............................................. 3,269 9.3 2,867 9.4 2,558 9.4
Rest of Asia-Pacific ................................. 3,548 10.1 2,762 9.1 2,087 7.7
North America1 ........................................ 10,193 29.1 8,758 28.8 7,915 29.2
Latin America1 ......................................... 4,166 11.9 3,426 11.3 2,530 9.3
35,047 100.0 30,452 100.0 27,118 100.0
Intra-HSBC elimination ........................... (1,494) (938) (631)
Total operating expenses ......................... 33,553 29,514 26,487
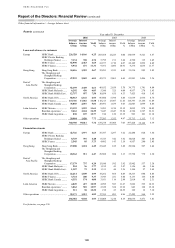
Year ended 31 December
2006 2005 2004
US$m US$m US$m
By expense category
Employee compensation and benefits2 ............................................................ 18,500 16,145 14,523
Premises and equipment (excluding depreciation and impairment) ............... 3,389 2,977 2,615
General and administrative expenses .............................................................. 9,434 8,206 7,124
Administrative expenses .................................................................................. 31,323 27,328 24,262
Depreciation and impairment of property, plant and equipment .................... 1,514 1,632 1,731
Amortisation and impairment of intangible assets3......................................... 716 554 494
Total operating expenses ................................................................................. 33,553 29,514 26,487
At 31 December
2006 2005 2004
Staff numbers (full-time equivalent)
Europe .............................................................................................................. 78,311 77,755 74,861
Hong Kong ...................................................................................................... 27,586 25,931 25,552
Rest of Asia-Pacific ......................................................................................... 72,265 55,577 41,031
North America1 ................................................................................................ 55,642 53,608 49,416
Latin America1 ................................................................................................. 67,116 55,600 52,473
Total staff numbers .......................................................................................... 300,920 268,471 243,333
1 In 2006, Mexico and Panama were reclassified from the North America segment to the Latin America segment. Comparative
information has been restated accordingly.
2 A charge of US$135 million was realised in 2006 arising from the waiver of the TSR-related performance condition in respect of the
2003 awards under the HSBC Holdings Group Share Option Plan (‘the Plan’). As explained in the Annual Report and Accounts 2005,
in light of the impressive and sustained performance and shareholder returns over the three years covered by the 2003 awards, the
Group Remuneration Committee exercised its discretion, as permitted within the Plan, to waive the TSR performance condition. Under
both IFRSs and US GAAP this is treated as a modification which requires an additional accounting charge: this is a non-cash item.
3 Intangible asset amortisation comprises the expensing through the income statement of purchased intangibles such as mortgage
servicing rights and customer/merchant relationships and amounts allocated to intangible assets on the fair valuation of assets within
acquired business combinations. This latter category principally includes customer relationships.