HSBC 2006 Annual Report Download - page 200
Download and view the complete annual report
Please find page 200 of the 2006 HSBC annual report below. You can navigate through the pages in the report by either clicking on the pages listed below, or by using the keyword search tool below to find specific information within the annual report.-
 1
1 -
2
-
3
-
4
-
5
-
6
-
7
-
8
-
9
-
10
-
11
-
12
-
13
-
14
-
15
-
16
-
17
-
18
-
19
-
20
-
21
-
22
-
23
-
24
-
25
-
26
-
27
-
28
-
29
-
30
-
31
-
32
-
33
-
34
-
35
-
36
-
37
-
38
-
39
-
40
-
41
-
42
-
43
-
44
-
45
-
46
-
47
-
48
-
49
-
50
-
51
-
52
-
53
-
54
-
55
-
56
-
57
-
58
-
59
-
60
-
61
-
62
-
63
-
64
-
65
-
66
-
67
-
68
-
69
-
70
-
71
-
72
-
73
-
74
-
75
-
76
-
77
-
78
-
79
-
80
-
81
-
82
-
83
-
84
-
85
-
86
-
87
-
88
-
89
-
90
-
91
-
92
-
93
-
94
-
95
-
96
-
97
-
98
-
99
-
100
-
101
-
102
-
103
-
104
-
105
-
106
-
107
-
108
-
109
-
110
-
111
-
112
-
113
-
114
-
115
-
116
-
117
-
118
-
119
-
120
-
121
-
122
-
123
-
124
-
125
-
126
-
127
-
128
-
129
-
130
-
131
-
132
-
133
-
134
-
135
-
136
-
137
-
138
-
139
-
140
-
141
-
142
-
143
-
144
-
145
-
146
-
147
-
148
-
149
-
150
-
151
-
152
-
153
-
154
-
155
-
156
-
157
-
158
-
159
-
160
-
161
-
162
-
163
-
164
-
165
-
166
-
167
-
168
-
169
-
170
-
171
-
172
-
173
-
174
-
175
-
176
-
177
-
178
-
179
-
180
-
181
-
182
-
183
-
184
-
185
-
186
-
187
-
188
-
189
-
 190
190 -
 191
191 -
 192
192 -
 193
193 -
 194
194 -
 195
195 -
 196
196 -
 197
197 -
 198
198 -
 199
199 -
 200
200 -
 201
201 -
 202
202 -
 203
203 -
 204
204 -
 205
205 -
 206
206 -
 207
207 -
 208
208 -
 209
209 -
 210
210 -
211
-
212
-
213
-
214
-
215
-
216
-
217
-
218
-
219
-
220
-
221
-
222
-
223
-
224
-
225
-
226
-
227
-
228
-
229
-
230
-
231
-
232
-
233
-
234
-
235
-
236
-
237
-
238
-
239
-
240
-
241
-
242
-
243
-
244
-
245
-
246
-
247
-
248
-
249
-
250
-
251
-
252
-
253
-
254
-
255
-
256
-
257
-
258
-
259
-
260
-
261
-
262
-
263
-
264
-
265
-
266
-
267
-
268
-
269
-
270
-
271
-
272
-
273
-
274
-
275
-
276
-
277
-
278
-
279
-
280
-
281
-
282
-
283
-
284
-
285
-
286
-
287
-
288
-
289
-
290
-
291
-
292
-
293
-
294
-
295
-
296
-
297
-
298
-
299
-
300
-
301
-
302
-
303
-
304
-
305
-
306
-
307
-
308
-
309
-
310
-
311
-
312
-
313
-
314
-
315
-
316
-
317
-
318
-
319
-
320
-
321
-
322
-
323
-
324
-
325
-
326
-
327
-
328
-
329
-
330
-
331
-
332
-
333
-
334
-
335
-
336
-
337
-
338
-
339
-
340
-
341
-
342
-
343
-
344
-
345
-
346
-
347
-
348
-
349
-
350
-
351
-
352
-
353
-
354
-
355
-
356
-
357
-
358
-
359
-
360
-
361
-
362
-
363
-
364
-
365
-
366
-
367
-
368
-
369
-
370
-
371
-
372
-
373
-
374
-
375
-
376
-
377
-
378
-
379
-
380
-
381
-
382
-
383
-
384
-
385
-
386
-
387
-
388
-
389
-
390
-
391
-
392
-
393
-
394
-
395
-
396
-
397
-
398
-
399
-
400
-
401
-
402
-
403
-
404
-
405
-
406
-
407
-
408
-
409
-
410
-
411
-
412
-
413
-
414
-
415
-
416
-
417
-
418
-
419
-
420
-
421
-
422
-
423
-
424
-
425
-
426
-
427
-
428
-
429
-
430
-
431
-
432
-
433
-
434
-
435
-
436
-
437
-
438
-
439
-
440
-
441
-
442
-
443
-
444
-
445
-
446
-
447
-
448
-
449
-
450
-
451
-
452
-
453
-
454
-
455
-
456
-
457
-
458
 |
 |

HSBC HOLDINGS PLC
Report of the Directors: The Management of Risk (continued)
Credit risk > Impairment allowances > 2006 / 2005
198
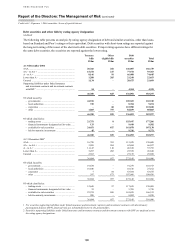
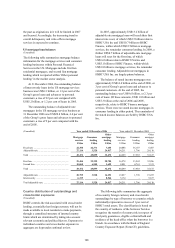
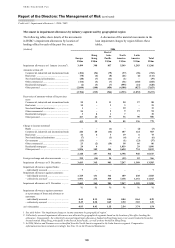
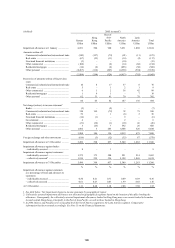
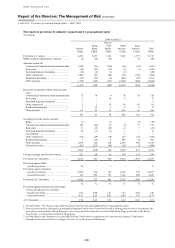
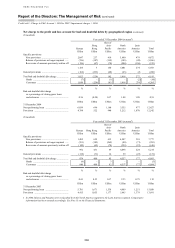
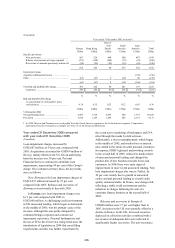
Movement in impairment allowances by industry segment and by geographical region
The following tables show details of the movements
in HSBC’s impairment allowances by location of
lending office for each of the past five years.
A discussion of the material movements in the
loan impairment charges by region follows these
tables.
(Audited) 2006
Europe
Hong
Kong
Rest of
Asia-
Pacific
North
America
Latin
America
Total
US$m US$m US$m US$m US$m US$m
Impairment allowances at 1 January (restated3). 3,499 398 837 5,349 1,283 11,366
Amounts written off
Commercial, industrial and international trade (454) (56) (79) (97) (96) (782)
Real estate ....................................................... (70) (6) (8) (21) (6) (111)
Non-bank financial institutions ....................... (20) (7) (11) (1) – (39)
Other commercial ............................................ (116) (3) (7) (31) (103) (260)
Residential mortgages ..................................... (2) (3) (7) (595) (21) (628)
Other personal ................................................. (2,044) (140) (454) (4,188) (827) (7,653)
(2,706) (215) (566) (4,933) (1,053) (9,473)
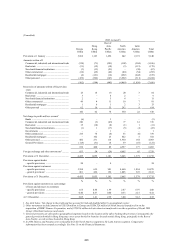
Recoveries of amounts written off in previous
years
Commercial, industrial and international trade 25 5 11 20 27 88
Real estate ....................................................... 15 – 3 3 – 21
Non-bank financial institutions ....................... 1 – – 10 – 11
Other commercial ............................................ 24 – 2 9 19 54
Residential mortgages ..................................... 3 8 1 7 – 19
Other personal ................................................. 357 26 77 36 90 586
425 39 94 85 136 779
Charge to income statement1
Banks ............................................................... – – (1) – (2) (3)
Commercial, industrial and international trade 246 40 (14) 107 124 503
Real estate ....................................................... 41 6 3 19 6 75
Non-bank financial institutions ....................... (7) – (1) (4) 6 (6)
Governments ................................................... (13) – – (1) (23) (37)
Other commercial ............................................ 23 (2) (19) 18 66 86
Residential mortgages ..................................... 24 4 – 1,039 29 1,096
Other personal ................................................. 1,826 109 544 5,620 734 8,833
2,140 157 512 6,798 940 10,547
Foreign exchange and other movements ............ 325 (14) 24 (52) 83 366
Impairment allowances at 31 December ............ 3,683 365 901 7,247 1,389 13,585
Impairment allowances against banks:
– individually assessed .................................... 7 – – – – 7
Impairment allowances against customers:
– individually assessed .................................... 1,725 131 362 109 238 2,565
– collectively assessed2 ................................... 1,951 234 539 7,138 1,151 11,013
Impairment allowances at 31 December ............ 3,683 365 901 7,247 1,389 13,585
% % % % % %
Impairment allowances against customers
as a percentage of loans and advances to
customers:
– individually assessed .................................... 0.44 0.15 0.46 0.04 0.64 0.29
– collectively assessed .................................... 0.49 0.28 0.69 2.50 3.10 1.25
At 31 December .................................................. 0.93 0.43 1.15 2.54 3.74 1.54
1 See table below ‘Net impairment charge to income statement by geographical region’.
2 Collectively assessed impairment allowances are allocated to geographical segments based on the location of the office booking the
allowance. Consequently, the collectively assessed impairment allowances booked in Hong Kong may cover assets booked in branches
located outside Hong Kong, principally in the Rest of Asia-Pacific, as well as those booked in Hong Kong.
3 In 2006, Mexico and Panama were reclassified from the North America segment to the Latin America segment. Comparative
information has been restated accordingly. See Note 13 on the Financial Statements.