HSBC 2006 Annual Report Download - page 296
Download and view the complete annual report
Please find page 296 of the 2006 HSBC annual report below. You can navigate through the pages in the report by either clicking on the pages listed below, or by using the keyword search tool below to find specific information within the annual report.-
 1
1 -
2
-
3
-
4
-
5
-
6
-
7
-
8
-
9
-
10
-
11
-
12
-
13
-
14
-
15
-
16
-
17
-
18
-
19
-
20
-
21
-
22
-
23
-
24
-
25
-
26
-
27
-
28
-
29
-
30
-
31
-
32
-
33
-
34
-
35
-
36
-
37
-
38
-
39
-
40
-
41
-
42
-
43
-
44
-
45
-
46
-
47
-
48
-
49
-
50
-
51
-
52
-
53
-
54
-
55
-
56
-
57
-
58
-
59
-
60
-
61
-
62
-
63
-
64
-
65
-
66
-
67
-
68
-
69
-
70
-
71
-
72
-
73
-
74
-
75
-
76
-
77
-
78
-
79
-
80
-
81
-
82
-
83
-
84
-
85
-
86
-
87
-
88
-
89
-
90
-
91
-
92
-
93
-
94
-
95
-
96
-
97
-
98
-
99
-
100
-
101
-
102
-
103
-
104
-
105
-
106
-
107
-
108
-
109
-
110
-
111
-
112
-
113
-
114
-
115
-
116
-
117
-
118
-
119
-
120
-
121
-
122
-
123
-
124
-
125
-
126
-
127
-
128
-
129
-
130
-
131
-
132
-
133
-
134
-
135
-
136
-
137
-
138
-
139
-
140
-
141
-
142
-
143
-
144
-
145
-
146
-
147
-
148
-
149
-
150
-
151
-
152
-
153
-
154
-
155
-
156
-
157
-
158
-
159
-
160
-
161
-
162
-
163
-
164
-
165
-
166
-
167
-
168
-
169
-
170
-
171
-
172
-
173
-
174
-
175
-
176
-
177
-
178
-
179
-
180
-
181
-
182
-
183
-
184
-
185
-
186
-
187
-
188
-
189
-
190
-
191
-
192
-
193
-
194
-
195
-
196
-
197
-
198
-
199
-
200
-
201
-
202
-
203
-
204
-
205
-
206
-
207
-
208
-
209
-
210
-
211
-
212
-
213
-
214
-
215
-
216
-
217
-
218
-
219
-
220
-
221
-
222
-
223
-
224
-
225
-
226
-
227
-
228
-
229
-
230
-
231
-
232
-
233
-
234
-
235
-
236
-
237
-
238
-
239
-
240
-
241
-
242
-
243
-
244
-
245
-
246
-
247
-
248
-
249
-
250
-
251
-
252
-
253
-
254
-
255
-
256
-
257
-
258
-
259
-
260
-
261
-
262
-
263
-
264
-
265
-
266
-
267
-
268
-
269
-
270
-
271
-
272
-
273
-
274
-
275
-
276
-
277
-
278
-
279
-
280
-
281
-
282
-
283
-
284
-
285
-
 286
286 -
 287
287 -
 288
288 -
 289
289 -
 290
290 -
 291
291 -
 292
292 -
 293
293 -
 294
294 -
 295
295 -
 296
296 -
 297
297 -
 298
298 -
 299
299 -
 300
300 -
 301
301 -
 302
302 -
 303
303 -
 304
304 -
 305
305 -
 306
306 -
307
-
308
-
309
-
310
-
311
-
312
-
313
-
314
-
315
-
316
-
317
-
318
-
319
-
320
-
321
-
322
-
323
-
324
-
325
-
326
-
327
-
328
-
329
-
330
-
331
-
332
-
333
-
334
-
335
-
336
-
337
-
338
-
339
-
340
-
341
-
342
-
343
-
344
-
345
-
346
-
347
-
348
-
349
-
350
-
351
-
352
-
353
-
354
-
355
-
356
-
357
-
358
-
359
-
360
-
361
-
362
-
363
-
364
-
365
-
366
-
367
-
368
-
369
-
370
-
371
-
372
-
373
-
374
-
375
-
376
-
377
-
378
-
379
-
380
-
381
-
382
-
383
-
384
-
385
-
386
-
387
-
388
-
389
-
390
-
391
-
392
-
393
-
394
-
395
-
396
-
397
-
398
-
399
-
400
-
401
-
402
-
403
-
404
-
405
-
406
-
407
-
408
-
409
-
410
-
411
-
412
-
413
-
414
-
415
-
416
-
417
-
418
-
419
-
420
-
421
-
422
-
423
-
424
-
425
-
426
-
427
-
428
-
429
-
430
-
431
-
432
-
433
-
434
-
435
-
436
-
437
-
438
-
439
-
440
-
441
-
442
-
443
-
444
-
445
-
446
-
447
-
448
-
449
-
450
-
451
-
452
-
453
-
454
-
455
-
456
-
457
-
458
 |
 |

HSBC HOLDINGS PLC
Financial Statements (continued)
294
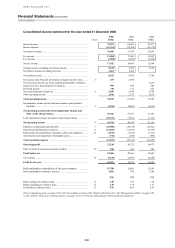
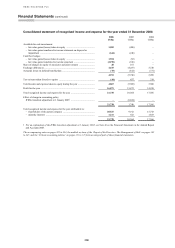
Consolidated income statement for the year ended 31 December 2006
2006 2005 2004
Notes US$m US$m US$m
Interest income .................................................................................... 75,879 60,094 50,471
Interest expense ................................................................................... (41,393) (28,760) (19,372)
Net interest income .............................................................................. 34,486 31,334 31,099
Fee income ........................................................................................... 21,080 17,486 15,902
Fee expense .......................................................................................... (3,898) (3,030) (2,954)
Net fee income ..................................................................................... 17,182 14,456 12,948
Trading income excluding net interest income ................................... 5,619 3,656 2,786
Net interest income on trading activities ............................................. 2,603 2,208 –
Net trading income .............................................................................. 8,222 5,864 2,786
Net income from financial instruments designated at fair value ........ 3 657 1,034 –
Net investment income on assets backing policyholders’ liabilities .. – – 1,012
Gains less losses from financial investments ...................................... 969 692 540
Dividend income .................................................................................. 340 155 622
Net earned insurance premiums .......................................................... 4 5,668 5,436 5,368
Other operating income ....................................................................... 2,546 2,733 1,613
Total operating income ..................................................................... 70,070 61,704 55,988
Net insurance claims incurred and movement in policyholders’
liabilities ......................................................................................... 5 (4,704) (4,067) (4,635)
Net operating income before loan impairment charges and
other credit risk provisions .......................................................... 65,366 57,637 51,353
Loan impairment charges and other credit risk provisions ................. (10,573) (7,801) (6,191)
Net operating income ........................................................................ 6 54,793 49,836 45,162
Employee compensation and benefits ................................................. 7 (18,500) (16,145) (14,523)
General and administrative expenses .................................................. 8 (12,823) (11,183) (9,739)
Depreciation and impairment of property, plant and equipment ........ 23 (1,514) (1,632) (1,731)
Amortisation and impairment of intangible assets............................... (716) (554) (494)
Total operating expenses ................................................................... (33,553) (29,514) (26,487)
Operating profit ................................................................................. 21,240 20,322 18,675
Share of profit in associates and joint ventures ................................... 20 846 644 268
Profit before tax ................................................................................. 22,086 20,966 18,943
Tax expense ......................................................................................... 10 (5,215) (5,093) (4,685)
Profit for the year .............................................................................. 16,871 15,873 14,258
Profit attributable to shareholders of the parent company .................. 15,789 15,081 12,918
Profit attributable to minority interests ............................................... 1,082 792 1,340
US$ US$ US$
Basic earnings per ordinary share ....................................................... 12 1.40 1.36 1.18
Diluted earnings per ordinary share .................................................... 12 1.39 1.35 1.17
Dividends per ordinary share .............................................................. 11 0.76 0.69 0.63
The accompanying notes on pages 301 to 434, the audited sections of the ‘Report of the Directors: The Management of Risk’ on pages 165
to 247, and the ‘Critical accounting policies’ on pages 111 to 115 form an integral part of these financial statements.