Apple 2001 Annual Report Download - page 11
Download and view the complete annual report
Please find page 11 of the 2001 Apple annual report below. You can navigate through the pages in the report by either clicking on the pages listed below, or by using the keyword search tool below to find specific information within the annual report.-
 1
1 -
 2
2 -
 3
3 -
 4
4 -
 5
5 -
 6
6 -
 7
7 -
 8
8 -
 9
9 -
 10
10 -
 11
11 -
 12
12 -
 13
13 -
 14
14 -
 15
15 -
 16
16 -
 17
17 -
 18
18 -
 19
19 -
 20
20 -
 21
21 -
 22
22 -
23
-
24
-
25
-
26
-
27
-
28
-
29
-
30
-
31
-
32
-
33
-
34
-
35
-
36
-
37
-
38
-
39
-
40
-
41
-
42
-
43
-
44
-
45
-
46
-
47
-
48
-
49
-
50
-
51
-
52
-
53
-
54
-
55
-
56
-
57
-
58
-
59
-
60
-
61
-
62
-
63
-
64
-
65
-
66
-
67
 |
 |

was filed by largely the same plaintiffs on June 14, 2000. This case is essentially the same as Sternberg but with respect to a different computer
model—the Power Macintosh G4. The Company answered both complaints, denying all allegations and alleging numerous affirmative
defenses. The parties reached a settlement in August 2001 which has been preliminarily approved by the Court. Settlement of these matters is
not expected to have a material adverse impact on the Company's results of operations, liquidity, or financial condition.
Item 4. Submission of Matters to a Vote of Security Holders
No matters were submitted to a vote of security holders during the fourth quarter of the Company's fiscal year ended September 29, 2001.
12
PART II
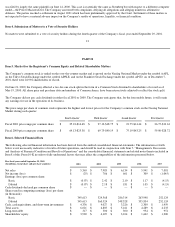
Item 5. Market for the Registrant's Common Equity and Related Shareholder Matters
The Company's common stock is traded on the over-the-
counter market and is quoted on the Nasdaq National Market under the symbol AAPL,
on the Tokyo Stock Exchange under the symbol APPLE, and on the Frankfurt Stock Exchange under the symbol APCD. As of December 7,
2001, there were 26,992 shareholders of record.
On June 21, 2000, the Company effected a two-for-one stock split in the form of a Common Stock dividend to shareholders of record as of
May 19, 2000. All share price and per share data and numbers of Common shares, have been retroactively adjusted to reflect the stock split.
The Company did not pay cash dividends in either fiscal 2001 or 2000. The Company anticipates that, for the foreseeable future, it will retain
any earnings for use in the operation of its business.
The price range per share of common stock represents the highest and lowest prices for the Company's common stock on the Nasdaq National
Market during each quarter.
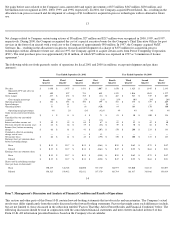
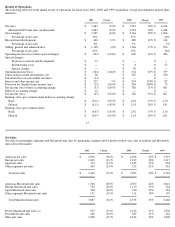
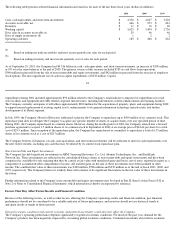
Item 6. Selected Financial Data
The following selected financial information has been derived from the audited consolidated financial statements. The information set forth
below is not necessarily indicative of results of future operations, and should be read in conjunction with Item 7, "Management's Discussion
and Analysis of Financial Condition and Results of Operations" and the consolidated financial statements and related notes thereto included in
Item 8 of this Form 10-K in order to fully understand factors that may affect the comparability of the information presented below.
Fourth Quarter
Third Quarter
Second Quarter
First Quarter
Fiscal 2001 price range per common share
$
25.22
-
$14.68
$
27.12
-
$18.75
$
23.75
-
$14.44
$
26.75
-
$13.63
Fiscal 2000 price range per common share
$
64.13
-
$25.38
$
69.75
-
$40.19
$
75.19
-
$43.25
$
59.00
-
$28.72
Five fiscal years ended September 29, 2001
(In millions, except share and per share amounts)
2001
2000
1999
1998
1997
Net sales
$
5,363
$
7,983
$
6,134
$
5,941
$
7,081
Net income (loss)
$
(25
)
$
786
$
601
$
309
$
(1,045
)
Earnings (loss) per common share:
Basic
$
(0.07
)
$
2.42
$
2.10
$
1.17
$
(4.15
)
Diluted
$
(0.07
)
$
2.18
$
1.81
$
1.05
$
(4.15
)
Cash dividends declared per common share
$
—
$
—
$
—
$
—
$
—
Shares used in computing earnings (loss) per share
(in thousands):
Basic
345,613
324,568
286,314
263,948
252,124
Diluted
345,613
360,324
348,328
335,834
252,124
Cash, cash equivalents, and short
-
term investments
$
4,336
$
4,027
$
3,226
$
2,300
$
1,459
Total assets
$
6,021
$
6,803
$
5,161
$
4,289
$
4,233
Long
-
term debt
$
317
$
300
$
300
$
954
$
951
Shareholders' equity
$
3,920
$
4,107
$
3,104
$
1,642
$
1,200