Apple 2001 Annual Report Download - page 20
Download and view the complete annual report
Please find page 20 of the 2001 Apple annual report below. You can navigate through the pages in the report by either clicking on the pages listed below, or by using the keyword search tool below to find specific information within the annual report.-
 1
1 -
2
-
3
-
4
-
5
-
6
-
7
-
8
-
9
-
 10
10 -
 11
11 -
 12
12 -
 13
13 -
 14
14 -
 15
15 -
 16
16 -
 17
17 -
 18
18 -
 19
19 -
 20
20 -
 21
21 -
 22
22 -
 23
23 -
 24
24 -
 25
25 -
 26
26 -
 27
27 -
 28
28 -
 29
29 -
 30
30 -
31
-
32
-
33
-
34
-
35
-
36
-
37
-
38
-
39
-
40
-
41
-
42
-
43
-
44
-
45
-
46
-
47
-
48
-
49
-
50
-
51
-
52
-
53
-
54
-
55
-
56
-
57
-
58
-
59
-
60
-
61
-
62
-
63
-
64
-
65
-
66
-
67
 |
 |

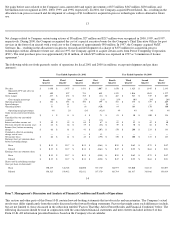
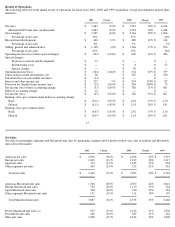
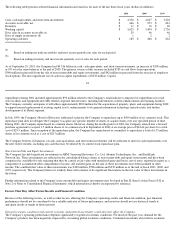
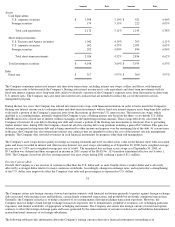
The following table presents selected financial information and statistics for each of the last three fiscal years (dollars in millions):
(a) Based on ending net trade receivables and most recent quarterly net sales for each period.
(b) Based on ending inventory and most recent quarterly cost of sales for each period.
As of September 29, 2001, the Company had $4.336 billion in cash, cash equivalents, and short-term investments, an increase of $309 million
or 8% over the same balances at the end of 2000. The primary sources of this increase included $185 in cash flows from operations,
$340 million in proceeds from the sale of non-current debt and equity investments, and $42 million in proceeds from the exercise of employee
stock options. The most significant use of cash was capital expenditures of $232 million. Capital
24
expenditures during 2001 included approximately $92 million related to the Company's retail initiative comprised of expenditures for retail
store facilities and equipment and other related corporate infrastructure, including information systems enhancements and training facilities.
The Company currently anticipates it will utilize approximately $200 million for the acquisition of property, plant, and equipment during 2002
to support normal replacement of existing capital assets, enhancements to its general information technology infrastructure, and further
development of its Retail segment.
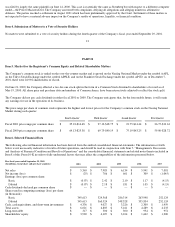
In July 1999, the Company's Board of Directors authorized a plan for the Company to repurchase up to $500 million of its common stock. This
repurchase plan does not obligate the Company to acquire any specific number of shares or acquire shares over any specified period of time.
During 2001, the Company repurchased no common shares. However, during the fourth quarter of 2001, the Company entered into a forward
purchase agreement to acquire 1.5 million shares of its common stock in September of 2003 at an average price of $16.64 per share for a total
cost of $25.5 million. Since inception of the repurchase plan, the Company has repurchased or committed to repurchase a total of 6.55 million
shares of its common stock at a cost of $217 million.
The Company believes its balances of cash, cash equivalents, and short-term investments will be sufficient to meet its cash requirements over
the next twelve months, including any cash that may be utilized by its current stock repurchase plan.
Non
-Current Debt and Equity Investments
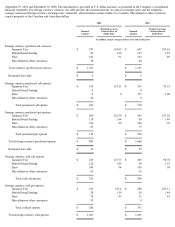
The Company has held significant investments in ARM, Samsung Electronics Co., Ltd, Akamai Technologies, Inc., and EarthLink
Network, Inc. These investments are reflected in the consolidated balance sheets as non
-current debt and equity investments and have been
categorized as available-for-
sale requiring that they be carried at fair value with unrealized gains and losses, net of taxes, reported in equity as a
component of accumulated other comprehensive income. All realized gains on the sale of these investments have been included in other
income. The combined fair value of these investments was $128 million, $786 million and $339 million as of the end of fiscal 2001, 2000, and
1999, respectively. The Company believes it is likely there will continue to be significant fluctuations in the fair value of these investments in
the future.
Further information related to the Company's non-current debt and equity investments may be found in Part II, Item 8 of this Form 10-K at
Note 2 of Notes to Consolidated Financial Statements, which information is hereby incorporated by reference.
Factors That May Affect Future Results and Financial Condition
Because of the following factors, as well as other factors affecting the Company's operating results and financial condition, past financial
performance should not be considered to be a reliable indicator of future performance, and investors should not use historical trends to
anticipate results or trends in future periods.
General economic conditions and current economic and political uncertainty could adversely affect the Company.
The Company's operating performance depends significantly on general economic conditions. For much of the past year, demand for the
Company's products has been negatively impacted by worsening global economic conditions. Continued uncertainty about future economic
2001
2000
1999
Cash, cash equivalents, and short
-
term investments
$
4,336
$
4,027
$
3,226
Accounts receivable, net
$
466
$
953
$
681
Inventory
$
11
$
33
$
20
Working capital
$
3,625
$
3,494
$
2,736
Days sales in accounts receivable (a)
29
46
46
Days of supply in inventory (b)
1
2
2
Operating cash flow
$
185
$
868
$
822