Apple 2001 Annual Report Download - page 16
Download and view the complete annual report
Please find page 16 of the 2001 Apple annual report below. You can navigate through the pages in the report by either clicking on the pages listed below, or by using the keyword search tool below to find specific information within the annual report.-
 1
1 -
2
-
3
-
4
-
5
-
 6
6 -
 7
7 -
 8
8 -
 9
9 -
 10
10 -
 11
11 -
 12
12 -
 13
13 -
 14
14 -
 15
15 -
 16
16 -
 17
17 -
 18
18 -
 19
19 -
 20
20 -
 21
21 -
 22
22 -
 23
23 -
 24
24 -
 25
25 -
 26
26 -
27
-
28
-
29
-
30
-
31
-
32
-
33
-
34
-
35
-
36
-
37
-
38
-
39
-
40
-
41
-
42
-
43
-
44
-
45
-
46
-
47
-
48
-
49
-
50
-
51
-
52
-
53
-
54
-
55
-
56
-
57
-
58
-
59
-
60
-
61
-
62
-
63
-
64
-
65
-
66
-
67
 |
 |

its own hardware and software products, the Company's retail stores carry in inventory a variety of third-party hardware and software and
provide certain hardware support services. The Company originally expected the Retail segment to break-even in the first quarter of 2002 and
generate a slight profit for all of 2002. However, given the continued deterioration of the U.S. economy and the aftereffects of the events of
September 11, 2001, the Company now expects its Retail segment to suffer a small loss for the first quarter of 2002 and for all of fiscal 2002.
The foregoing statements concerning the expected results of the Retail segment are forward-looking. The Retail segment's future results could
differ. Results for this segment are dependent upon a number of risks and uncertainties, some of which are discussed throughout this Item 2,
including the discussion under the heading "Factors That May Affect Future Results and Financial Condition."
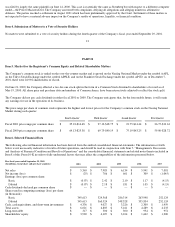
Backlog
In the Company's experience, the actual amount of product backlog at any particular time is not a meaningful indication of its future business
prospects. In particular, backlog often increases in anticipation of or immediately following new product introductions because of over-
ordering by dealers anticipating shortages. Backlog often is reduced once dealers and customers believe they can obtain sufficient supply.
Because of the foregoing, backlog should not be considered a reliable indicator of the Company's ability to achieve any particular level of
revenue or financial performance. Further information regarding the Company's backlog may be found below under the heading "Factors That
May Affect Future Results and Financial Condition," which information is hereby incorporated by reference.
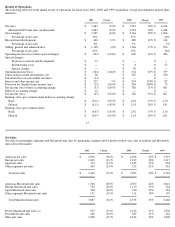
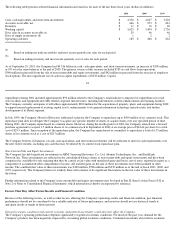
Gross Margin
Gross margin declined to 23.0% of net sales in 2001 from 27.1% in 2000. This decline resulted primarily from gross margin of negative 2.1%
experienced during the first quarter of 2001 compared to 25.9% gross margin for the same quarter in 2000. In addition to lower than normal net
sales, first quarter 2001 margins were negatively impacted by the rebate programs and price cuts discussed above that decreased revenue by
approximately $138 million. Additionally, actual and forecasted declines in net sales caused the Company to recognize during the first quarter
of 2001 approximately $122 million of charges associated with purchase order cancellations and loss commitments for component purchases.
Without these charges, gross margin for the first quarter of 2001 would have been approximately 21%, and gross margin for all of 2001 would
have been approximately 27.2%. As a percentage of net sales, the Company's gross margin increased each quarter as 2001 progressed reaching
30.1% during the fourth quarter. This trend reflects the favorable impact during 2001 of declining component costs; especially for DRAM, hard
drives, and flat panel screens. The Company currently anticipates that component costs will rise during 2002 as suppliers adjust capacity to
demand and worldwide economic conditions stabilize or improve. This anticipated rise in component costs is expected to have a negative
impact on the Company's gross margin during 2002.
The foregoing statements regarding anticipated industry component pricing and the Company's anticipated gross margin in 2002 are forward-
looking. Gross margin could differ from anticipated levels because of several factors, including certain of those set forth below in the
subsection entitled "Factors That May Affect Future Results and Financial Condition." There can be no assurance that current gross margins
will be maintained, targeted gross margin levels will be achieved, or current margins on existing individual products will be maintained. In
general, gross margins and margins on individual products will remain under significant downward pressure due to a variety of factors,
including continued industry wide global pricing pressures, increased competition, compressed product life cycles, potential increases in the
cost and availability of raw material and outside manufacturing services, and potential changes to the Company's product mix, including higher
unit sales of consumer products with lower average selling prices
19
and lower gross margins. In response to these downward pressures, the Company expects it will continue to take pricing actions with respect to
its products. Gross margins could also be affected by the Company's ability to effectively manage quality problems and warranty costs and to
stimulate demand for certain of its products. The Company's operating strategy and pricing take into account anticipated changes in foreign
currency exchange rates over time; however, the Company's results of operations can be significantly affected in the short term by fluctuations
in exchange rates.
Gross margin was relatively stable during 2000 as compared to 1999, declining to 27.1% during 2000 from 27.6% during 1999. The half point
decline was primarily the result of a shift in mix of unit sales away from the Company's higher priced, higher margin professionally oriented
Macintosh systems towards its lower priced, lower margin consumer and education oriented Macintosh systems. Also contributing to the
relative stability of its gross margin, the Company experienced relatively stable component pricing during 2000 as compared to 1999.
Research and Development
The Company recognizes that focused investments in research and development are critical to its future growth and competitive position in the
marketplace and are directly related to timely development of new and enhanced products that are central to the Company's core business
strategy. Expenditures on research and development increased 13% or $50 million to $430 million in 2001 as compared to 2000. This followed
a $66 million or 21% increase in 2000 as compared to 1999. The overall increase in R&D spending over the last two years is directly related to
increases in R&D headcount of approximately 25% over that time to support expanded product development efforts.
Selling, General, and Administrative (SG&A)
SG&A expenditures decreased $28 million or 2% during 2001 as compared to 2000. Total quarterly SG&A expenditures have declined
consistently throughout 2001 from a high in the first quarter of $297 million to a low in the fourth quarter of $268 million. This trend reflects
the Company's efforts to stabilize and selectively reduce recurring SG&A costs in light of lower net sales and to reduce discretionary marketing