Apple 2001 Annual Report Download - page 12
Download and view the complete annual report
Please find page 12 of the 2001 Apple annual report below. You can navigate through the pages in the report by either clicking on the pages listed below, or by using the keyword search tool below to find specific information within the annual report.-
 1
1 -
 2
2 -
 3
3 -
 4
4 -
 5
5 -
 6
6 -
 7
7 -
 8
8 -
 9
9 -
 10
10 -
 11
11 -
 12
12 -
 13
13 -
 14
14 -
 15
15 -
 16
16 -
 17
17 -
 18
18 -
 19
19 -
 20
20 -
 21
21 -
 22
22 -
23
-
24
-
25
-
26
-
27
-
28
-
29
-
30
-
31
-
32
-
33
-
34
-
35
-
36
-
37
-
38
-
39
-
40
-
41
-
42
-
43
-
44
-
45
-
46
-
47
-
48
-
49
-
50
-
51
-
52
-
53
-
54
-
55
-
56
-
57
-
58
-
59
-
60
-
61
-
62
-
63
-
64
-
65
-
66
-
67
 |
 |

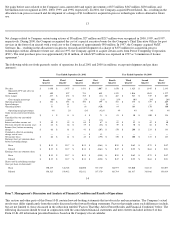
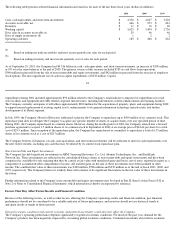
Net gains before taxes related to the Company's non
-current debt and equity investments of $75 million, $367 million, $230 million, and
$40 million were recognized in 2001, 2000, 1999, and 1998, respectively. In 2001, the Company acquired PowerSchool, Inc., resulting in the
allocation to in-process research and development of a charge of $11 million for acquired in-process technologies with no alternative future
use.
13
Net charges related to Company restructuring actions of $8 million, $27 million and $217 million were recognized in 2000, 1999, and 1997,
respectively. During 2000, the Company recognized the cost of a special executive bonus for the Company's Chief Executive Officer for past
services in the form of an aircraft with a total cost to the Company of approximately $90 million. In 1997, the Company acquired NeXT
Software, Inc., resulting in the allocation to in-process research and development of a charge of $375 million for acquired in-process
technologies with no alternative future use. Also in 1997, the Company agreed to acquire certain assets from Power Computing Corporation
(PCC). The total purchase price was approximately $110 million, of which $75 million was expensed in 1997 as "termination of license
agreement."
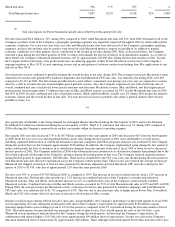
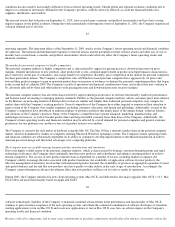
The following table sets forth quarterly results of operations for fiscal 2001 and 2000 (in millions, except unit shipment and per share
amounts):
14
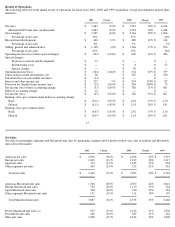
Item 7. Management's Discussion and Analysis of Financial Condition and Results of Operations
This section and other parts of this Form 10-K contain forward-looking statements that involve risks and uncertainties. The Company's actual
results may differ significantly from the results discussed in the forward-looking statements. Factors that might cause such differences include,
but are not limited to, those discussed in the subsection entitled "Factors That May Affect Future Results and Financial Condition" below. The
following discussion should be read in conjunction with the consolidated financial statements and notes thereto included in Item 8 of this
Form 10
-
K. All information presented herein is based on the Company's fiscal calendar.
Year Ended September 29, 2001
Year Ended September 30, 2000
Fourth
Quarter
Third
Quarter
Second
Quarter
First
Quarter
Fourth
Quarter
Third
Quarter
Second
Quarter
First
Quarter
Net sales
$
1,450
$
1,475
$
1,431
$
1,007
$
1,870
$
1,825
$
1,945
$
2,343
Macintosh CPU unit sales (in
thousands)
850
827
751
659
1,122
1,016
1,043
1,377
Gross margin $
437
$
434
$
385
$
(21
) $
467
$
543
$
549
$
607
Gross margin percentage
30
%
29
%
27
%
(2
)%
25
%
30
%
28
%
26
%
Operating expenses $
384
$
392
$
393
$
399
$
383
$
375
$
379
$
409
Special charges —
11
— — — — —
98
Operating income
53
31
(8
)
(420
)
84
168
170
100
Operating margin percentage
4
%
2
%
(1
)%
(42
)%
4
%
9
%
9
%
4
%
Gains on non-current investments,
net $
1
$
11
$
5
$
71
$
83
$
50
$
100
$
134
Unrealized loss on convertible
securities — — — $ (
13
) — — — —
Interest and other income, net $
40
$
45
$
65
$
67
$
62
$
52
$
49
$
40
Provision (benefit) for income taxes
$
28
$
26
$
19
$
(88
)
$
59
$
70
$
86
$
91
Income (loss) before accounting
change $
66
$
61
$
43
$
(207
) $
170
$
200
$
233
$
183
Cumulative effect of accounting
change, net of taxes
—
—
—
$
12
—
—
—
—
Net income (loss)
$
66
$
61
$
43
$
(195
) $
170
$
200
$
233
$
183
Earnings (loss) per common share
before accounting change:
Basic $
0.19
$
0.17
$
0.12
$
(0.61
) $
0.52
$
0.62
$
0.72
$
0.57
Diluted $
0.19
$
0.17
$
0.12
$
(0.61
) $
0.47
$
0.55
$
0.64
$
0.51
Earnings (loss) per common share:
Basic
$
0.19
$
0.17
$
0.12
$
(0.58
)
$
0.52
$
0.62
$
0.72
$
0.57
Diluted $
0.19
$
0.17
$
0.12
$
(0.58
) $
0.47
$
0.55
$
0.64
$
0.51
Shares used in calculating earnings
(loss) per share (in thousands):
Basic
350,819
348,765
346,080
337,170
326,977
325,040
324,343
322,077
Diluted
356,525
358,912
352,812
337,170
361,784
361,817
363,986
356,834