Apple 2001 Annual Report Download - page 33
Download and view the complete annual report
Please find page 33 of the 2001 Apple annual report below. You can navigate through the pages in the report by either clicking on the pages listed below, or by using the keyword search tool below to find specific information within the annual report.-
 1
1 -
2
-
3
-
4
-
5
-
6
-
7
-
8
-
9
-
10
-
11
-
12
-
13
-
14
-
15
-
16
-
17
-
18
-
19
-
20
-
21
-
22
-
 23
23 -
 24
24 -
 25
25 -
 26
26 -
 27
27 -
 28
28 -
 29
29 -
 30
30 -
 31
31 -
 32
32 -
 33
33 -
 34
34 -
 35
35 -
 36
36 -
 37
37 -
 38
38 -
 39
39 -
 40
40 -
 41
41 -
 42
42 -
 43
43 -
44
-
45
-
46
-
47
-
48
-
49
-
50
-
51
-
52
-
53
-
54
-
55
-
56
-
57
-
58
-
59
-
60
-
61
-
62
-
63
-
64
-
65
-
66
-
67
 |
 |

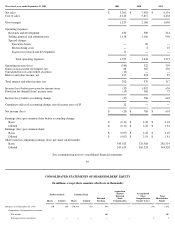
See accompanying notes to consolidated financial statements.
41
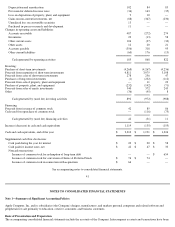
NOTES TO CONSOLIDATED FINANCIAL STATEMENTS
Note 1—Summary of Significant Accounting Policies
Apple Computer, Inc. and its subsidiaries (the Company) designs, manufactures, and markets personal computers and related software and
peripherals for sale primarily to education, creative, consumer, and business customers.
Basis of Presentation and Preparation
The accompanying consolidated financial statements include the accounts of the Company. Intercompany accounts and transactions have been
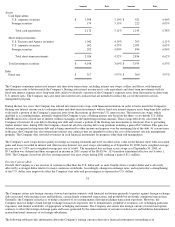
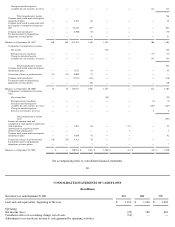
Depreciation and amortization
102
84
85
Provision for deferred income taxes
(36
)
163
(35
)
Loss on disposition of property, plant, and equipment
9
10
—
Gains on non
-
current investments, net
(88
)
(367
)
(230
)
Unrealized loss on convertible securities
13
—
—
Purchased in
-
process research and development
11
—
—
Changes in operating assets and liabilities:
Accounts receivable
487
(272
)
274
Inventories
22
(13
)
58
Other current assets
106
(37
)
(32
)
Other assets
12
20
21
Accounts payable
(356
)
318
95
Other current liabilities
(60
)
176
(15
)
Cash generated by operating activities
185
868
822
Investing:
Purchase of short
-
term investments
(4,268
)
(4,267
)
(4,236
)
Proceeds from maturities of short
-
term investments
4,811
3,075
3,108
Proceeds from sales of short
-
term investments
278
256
47
Purchases of long
-
term investments
(1
)
(232
)
(112
)
Proceeds from sale of property, plant and equipment
—
11
23
Purchase of property, plant, and equipment
(232
)
(142
)
(71
)
Proceeds from sales of equity investments
340
372
245
Other
(36
)
(45
)
8
Cash generated by (used for) investing activities
892
(972
)
(988
)
Financing:
Proceeds from issuance of common stock
42
85
86
Cash used for repurchase of common stock
—
(
116
)
(75
)
Cash generated by (used for) financing activities
42
(31
)
11
Increase (decrease) in cash and cash equivalents
1,119
(135
)
(155
)
Cash and cash equivalents, end of the year
$
2,310
$
1,191
$
1,326
Supplemental cash flow disclosures:
Cash paid during the year for interest
$
20
$
20
$
58
Cash paid for income taxes, net
$
42
$
47
$
33
Noncash transactions:
Issuance of common stock for redemption of long
-
term debt
—
—
$
654
Issuance of common stock for conversion of Series A Preferred Stock
$
76
$
74
—
Issuance of common stock in connection with acquisition
$
66
—
—