Apple 2001 Annual Report Download - page 52
Download and view the complete annual report
Please find page 52 of the 2001 Apple annual report below. You can navigate through the pages in the report by either clicking on the pages listed below, or by using the keyword search tool below to find specific information within the annual report.-
 1
1 -
2
-
3
-
4
-
5
-
6
-
7
-
8
-
9
-
10
-
11
-
12
-
13
-
14
-
15
-
16
-
17
-
18
-
19
-
20
-
21
-
22
-
23
-
24
-
25
-
26
-
27
-
28
-
29
-
30
-
31
-
32
-
33
-
34
-
35
-
36
-
37
-
38
-
39
-
40
-
41
-
 42
42 -
 43
43 -
 44
44 -
 45
45 -
 46
46 -
 47
47 -
 48
48 -
 49
49 -
 50
50 -
 51
51 -
 52
52 -
 53
53 -
 54
54 -
 55
55 -
 56
56 -
 57
57 -
 58
58 -
 59
59 -
 60
60 -
 61
61 -
 62
62 -
63
-
64
-
65
-
66
-
67
 |
 |

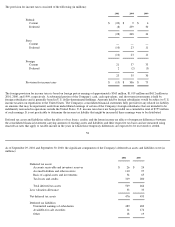
A large portion of the Company's net sales is derived from its international operations. Also, a majority of the raw materials used in the
Company's products is obtained from sources outside of the United States, and a majority of the products sold by the Company is assembled
internationally in the Company's facilities in Cork, Ireland and Singapore or by third-party vendors in Taiwan, Korea, Mexico, the People's
Republic of China, and the Czech Republic. As a result, the Company is subject to risks associated with foreign operations, such as obtaining
governmental permits and approvals, currency exchange fluctuations, currency restrictions, political instability, labor problems, trade
restrictions, and changes in tariff and freight charges. During 2000, a single distributor, Ingram Micro Inc. accounted for approximately 11.5%
of the Company's net sales. Net sales during 2000 to Ingram Micro Inc. in the Americas and Europe segments were $651 million and
$255 million, respectively. Net sales to Ingram Micro Inc. in all other segments were $14 million. No other single customer accounted for more
than 10% of net sales in 2000. No single customer accounted for more than 10% of net sales in 2001 or 1999.
68
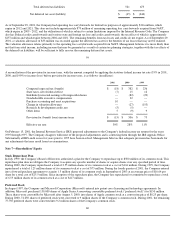
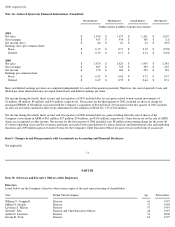
Net sales and long
-lived assets related to operations in the United States, Japan, and other foreign countries are as follows (in millions):
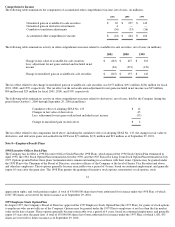
Information regarding net sales by product is as follows (in millions):
(a)
Includes amounts previously reported as G4 Cube.
Segment assets
$
630
$
1,098
$
835
Corporate assets
$
5,391
$
5,705
4,326
Consolidated assets $
6,021
$
6,803
$
5,161
Segment depreciation and amortization
$
14
$
14
$
12
Corporate depreciation and amortization
88
70
73
Consolidated depreciation and amortization $
102
$
84
$
85
2001
2000
1999
Net Sales:
United States
$
2,936
$
4,145
$
3,394
Japan
713
1,345
858
Other Foreign Countries
1,714
2,493
1,882
Total Net Sales $
5,363
$
7,983
$
6,134
Long
-
Lived Assets:
United States
$
498
$
387
$
335
Japan
3
5
7
Other Foreign Countries
77
52
62
Total Long-Lived Assets $
578
$
444
$
404
2001
2000
1999
Net Sales:
Power Macintosh (a)
$
1,664
$
2,747
$
2,345
PowerBook
813
948
823
iMac
1,117
2,381
1,905
iBook
809
809
9
Software, Service, and Other Net Sales
960
1,098
1,052
Total Net Sales $
5,363
$
7,983
$
6,134