Apple 2001 Annual Report Download - page 51
Download and view the complete annual report
Please find page 51 of the 2001 Apple annual report below. You can navigate through the pages in the report by either clicking on the pages listed below, or by using the keyword search tool below to find specific information within the annual report.-
 1
1 -
2
-
3
-
4
-
5
-
6
-
7
-
8
-
9
-
10
-
11
-
12
-
13
-
14
-
15
-
16
-
17
-
18
-
19
-
20
-
21
-
22
-
23
-
24
-
25
-
26
-
27
-
28
-
29
-
30
-
31
-
32
-
33
-
34
-
35
-
36
-
37
-
38
-
39
-
40
-
 41
41 -
 42
42 -
 43
43 -
 44
44 -
 45
45 -
 46
46 -
 47
47 -
 48
48 -
 49
49 -
 50
50 -
 51
51 -
 52
52 -
 53
53 -
 54
54 -
 55
55 -
 56
56 -
 57
57 -
 58
58 -
 59
59 -
 60
60 -
 61
61 -
62
-
63
-
64
-
65
-
66
-
67
 |
 |

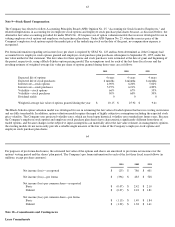
segments. Costs excluded from segment operating income include various corporate expenses, income taxes, and nonrecurring charges for
purchased in-process research and development and restructuring actions. Corporate expenses include research and development;
manufacturing expenses not included in segment cost of sales, including variances between standard and actual manufacturing costs; corporate
marketing expenses; and other separately managed general and administrative expenses. The Company does not include intercompany transfers
between segments for management reporting purposes.
66
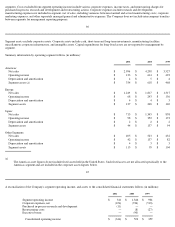
Segment assets exclude corporate assets. Corporate assets include cash, short-term and long-term investments, manufacturing facilities,
miscellaneous corporate infrastructure, and intangible assets. Capital expenditures for long-lived assets are not reported to management by
segment.
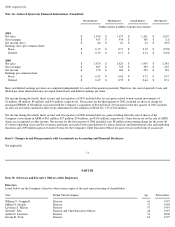
Summary information by operating segment follows (in millions):
(a) The Americas asset figures do not include fixed assets held in the United States. Such fixed assets are not allocated specifically to the
Americas segment and are included in the corporate assets figures below.
67
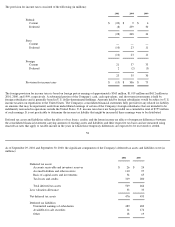
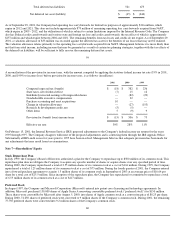
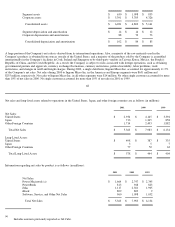
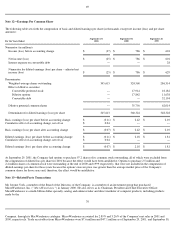
A reconciliation of the Company's segment operating income, and assets to the consolidated financial statements follows (in millions):
2001
2000
1999
Americas:
Net sales
$
2,996
$
4,298
$
3,527
Operating income $
133
$
614
$
493
Depreciation and amortization $
4
$
5
$
4
Segment assets (a) $
334
$
618
$
468
Europe:
Net sales
$
1,249
$
1,817
$
1,317
Operating income $
68
$
243
$
156
Depreciation and amortization $
4
$
4
$
3
Segment assets $
137
$
248
$
169
Japan:
Net sales
$
713
$
1,345
$
858
Operating income $
98
$
352
$
173
Depreciation and amortization $
2
$
2
$
2
Segment assets $
44
$
137
$
94
Other Segments:
Net sales
$
405
$
523
$
432
Operating income $
42
$
137
$
82
Depreciation and amortization $
4
$
3
$
3
Segment assets $
115
$
95
$
104
2001
2000
1999
Segment operating income
$
341
$
1,346
$
904
Corporate expenses, net
(674)
(726)
(518)
Purchased in
-
process research and development
(11)
—
—
Restructuring costs
—
(
8)
(27)
Executive bonus
—
(
90)
—
Consolidated operating income $
(344)
$
522
$
359