Apple 2001 Annual Report Download - page 13
Download and view the complete annual report
Please find page 13 of the 2001 Apple annual report below. You can navigate through the pages in the report by either clicking on the pages listed below, or by using the keyword search tool below to find specific information within the annual report.-
 1
1 -
2
-
 3
3 -
 4
4 -
 5
5 -
 6
6 -
 7
7 -
 8
8 -
 9
9 -
 10
10 -
 11
11 -
 12
12 -
 13
13 -
 14
14 -
 15
15 -
 16
16 -
 17
17 -
 18
18 -
 19
19 -
 20
20 -
 21
21 -
 22
22 -
 23
23 -
24
-
25
-
26
-
27
-
28
-
29
-
30
-
31
-
32
-
33
-
34
-
35
-
36
-
37
-
38
-
39
-
40
-
41
-
42
-
43
-
44
-
45
-
46
-
47
-
48
-
49
-
50
-
51
-
52
-
53
-
54
-
55
-
56
-
57
-
58
-
59
-
60
-
61
-
62
-
63
-
64
-
65
-
66
-
67
 |
 |

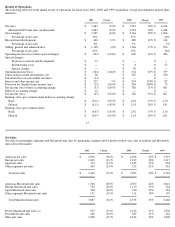
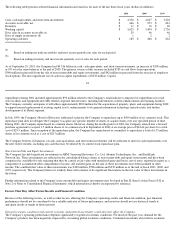
Results of Operations
The following table sets forth annual results of operations for fiscal years 2001, 2000, and 1999 (in millions, except unit shipment and per share
amounts):
15
Net Sales
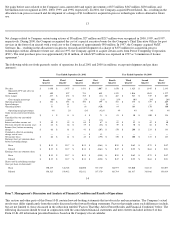
Net sales for geographic segments and Macintosh unit sales by geographic segment and by product follow (net sales in millions and Macintosh
unit sales in thousands):
2001
Change
2000
Change
1999
Net sales
$
5,363
(33
)%
$
7,983
30
%
$
6,134
Macintosh CPU unit sales (in thousands)
3,087
(32
)%
4,558
32
%
3,448
Gross margin
$
1,235
(43
)%
$
2,166
28
%
$
1,696
Percentage of net sales
23%
27%
28
%
Research and development
$
430
13
%
$
380
21
%
$
314
Percentage of net sales
8%
5%
5
%
Selling, general and administrative
$
1,138
(2
)%
$
1,166
17
%
$
996
Percentage of net sales
21%
15%
16
%
Operating income (loss) before special charges
$
(333
)
(154
)%
$
620
61
%
$
386
Special charges:
In
-
process research and development
$
11
$
—
$
—
Restructuring costs
$
—
$
8
$
27
Special charges
$
—
$
90
$
—
Operating income (loss)
$
(344
)
(166
)%
$
522
45
%
$
359
Gains on non
-
current investments, net
$
88
$
367
$
230
Unrealized loss on convertible securities
$
(13
)
$
—
$
—
Interest and other income, net
$
217
7
%
$
203
133
%
$
87
Provision for (benefit from) income taxes
$
(15
)
(105
)%
$
306
308
%
$
75
Net income (loss) before accounting change
$
(37
)
(105
)%
$
786
31
%
$
601
Effect of accounting change
$
12
$
—
$
—
Net income (loss)
$
(25
)
(103
)%
$
786
31
%
$
601
Earnings (loss) per common share before accounting change:
Basic
$
(0.11
)
(105
)%
$
2.42
15
%
$
2.10
Diluted
$
(0.11
)
(105
)%
$
2.18
20
%
$
1.81
Earnings (loss) per common share:
Basic
$
(0.07
)
(103
)%
$
2.42
15
%
$
2.10
Diluted
$
(0.07
)
(103
)%
$
2.18
20
%
$
1.81
2001
Change
2000
Change
1999
Americas net sales
$
2,996
(30
)%
$
4,298
22
%
$
3,527
Europe net sales
1,249
(31
)%
1,817
38
%
1,317
Japan net sales
713
(47
)%
1,345
57
%
858
Other segments net sales
405
(23
)%
523
21
%
432
Total net sales $
5,363
(33
)% $
7,983
30
% $
6,134
Americas Macintosh unit sales
1,768
(29
)%
2,507
24
%
2,021
Europe Macintosh unit sales
754
(32
)%
1,110
53
%
724
Japan Macintosh unit sales
394
(46
)%
730
39
%
524
Other segments Macintosh unit sales
171
(19
)%
211
18
%
179
Total Macintosh unit sales
3,087
(32
)%
4,558
32
%
3,448
Power Macintosh unit sales (a)
937
(35
)%
1,436
11
%
1,296
PowerBook unit sales
346
(10
)%
383
11
%
344
iMac unit sales
1,208
(45
)%
2,194
22
%
1,802