Charter 2012 Annual Report Download - page 45
Download and view the complete annual report
Please find page 45 of the 2012 Charter annual report below. You can navigate through the pages in the report by either clicking on the pages listed below, or by using the keyword search tool below to find specific information within the annual report.-
 1
1 -
2
-
3
-
4
-
5
-
6
-
7
-
8
-
9
-
10
-
11
-
12
-
13
-
14
-
15
-
16
-
17
-
18
-
19
-
20
-
21
-
22
-
23
-
24
-
25
-
26
-
27
-
28
-
29
-
30
-
31
-
32
-
33
-
34
-
 35
35 -
 36
36 -
 37
37 -
 38
38 -
 39
39 -
 40
40 -
 41
41 -
 42
42 -
 43
43 -
 44
44 -
 45
45 -
 46
46 -
 47
47 -
 48
48 -
 49
49 -
 50
50 -
 51
51 -
 52
52 -
 53
53 -
 54
54 -
 55
55 -
56
-
57
-
58
-
59
-
60
-
61
-
62
-
63
-
64
-
65
-
66
-
67
-
68
-
69
-
70
-
71
-
72
-
73
-
74
-
75
-
76
-
77
-
78
-
79
-
80
-
81
-
82
-
83
-
84
-
85
-
86
-
87
-
88
-
89
-
90
-
91
-
92
-
93
-
94
-
95
-
96
-
97
-
98
-
99
-
100
-
101
-
102
-
103
-
104
-
105
-
106
-
107
-
108
-
109
-
110
-
111
-
112
-
113
-
114
-
115
-
116
-
117
-
118
-
119
-
120
-
121
-
122
-
123
-
124
-
125
-
126
 |
 |
33
Item 7. Management’s Discussion and Analysis of Financial Condition and Results of Operations.
Reference is made to “Part I. Item 1A. Risk Factors” and “Cautionary Statement Regarding Forward-Looking Statements,” which
describe important factors that could cause actual results to differ from expectations and non-historical information contained
herein. In addition, the following discussion should be read in conjunction with the audited consolidated financial statements and
accompanying notes thereto of Charter Communications, Inc. and subsidiaries included in “Item 8. Financial Statements and
Supplementary Data.”
Overview
We are a cable operator providing services in the United States with approximately 5.4 million residential and commercial customers
at December 31, 2012. We offer our customers traditional cable video programming, Internet services, and telephone services,
as well as advanced video services such as OnDemandTM, HD television and DVR service. We also sell local advertising on cable
networks and provide fiber connectivity to cellular towers. See “Part I. Item 1. Business — Products and Services” for further
description of these services, including “customers.”
Our most significant competitors are DBS providers and certain telephone companies that offer services that provide features and
functions similar to our video, high-speed Internet, and telephone services, including in some cases wireless services, and they
also offer these services in bundles similar to ours. See “Business — Competition.” In the recent past, we have grown revenues
by offsetting basic video customer losses with price increases and sales of incremental services such as high-speed Internet,
OnDemand, DVR and HD television. We expect to continue to grow revenues by increasing the number of products in our current
customer homes and obtaining new customers with an improved value offering. In addition, we expect to increase revenues by
expanding the sales of services to our commercial customers. However, we cannot assure you that we will be able to grow revenues
or maintain our margins at recent historical rates.
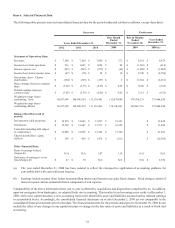
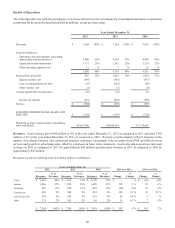
Total revenue growth was 4% for the year ended December 31, 2012 compared to the corresponding period in 2011, and 2% for
the year ended December 31, 2011 compared to the corresponding period in 2010, as we continued to grow our Internet and
commercial businesses and also due to increased advertising revenue. Video revenues remained flat during the year ended December
31, 2012 compared to the corresponding prior period and declined 2% during the year ended December 31, 2011 compared to the
corresponding prior period. For the years ended December 31, 2012, 2011 and 2010, adjusted earnings (loss) before interest
expense, income taxes, depreciation and amortization (“Adjusted EBITDA”) was $2.7 billion, $2.7 billion and $2.6 billion,
respectively. See “—Use of Adjusted EBITDA and Free Cash Flow” for further information on Adjusted EBITDA and free cash
flow. Adjusted EBITDA remained flat for the year ended December 31, 2012 compared to the corresponding period in 2011 as
a result of an increase in Internet, commercial and advertising revenues offset by higher programming costs, expenses associated
with driving higher growth and investments in the customer experience. For the year ended December 31, 2012, our income from
operations was $916 million, and for each of the years ended December 31, 2011 and 2010, our income from operations was $1.0
billion. The decrease in income from operations for the year ended December 31, 2012 compared to the corresponding prior
periods is primarily due to increases in depreciation and amortization.
Our business plans include goals for increasing the number of customers and revenue. To reach our goals, we have been working
to further improve the quality of the video product we offer by increasing digital and HD-DVR penetration and no longer actively
marketing analog service. In 2012, we accelerated these improvements. Our goal was 100 HD channels across substantially all
of our footprint by the end of the year and we reached that goal in July 2012. We have simplified our offers and pricing and
improved our packaging of products to bring more value to our customers, with particular focus on offers aimed at new customers
to increase the penetration of our products in our markets including through our emphasis on the triple play. In addition, we are
implementing a number of changes to our organizational structure, selling methods and operating tactics which we believe will
position us for better customer service and growth. In the short term, however, we expect that customer connects, revenue and
operating expenses may be adversely impacted during this transition. We also expect our capital expenditures to remain elevated
as we strive to increase digital and HD-DVR penetration, place higher levels of customer premise equipment per transaction and
progressively move to an all-digital platform.
We believe that continued competition and the weakened economic conditions in the United States, including weakness in the
housing market and relatively high unemployment levels, have adversely affected consumer demand for our services, particularly
basic video. Our video competitors often offer more channels, including more HD channels, and typically only offer digital
services which have a better picture quality compared to our analog product. In the current economic environment, customers
have been more willing to consider our competitors' products, partially because of increased marketing highlighting perceived
differences between competitive video products, especially when those competitors are often offering significant incentives to
switch providers. We also believe some customers have chosen to receive video over the Internet rather than through our OnDemand
and premium video services, thereby reducing our video revenues. We believe competition from wireless and economic factors