Charter 2012 Annual Report Download - page 53
Download and view the complete annual report
Please find page 53 of the 2012 Charter annual report below. You can navigate through the pages in the report by either clicking on the pages listed below, or by using the keyword search tool below to find specific information within the annual report.-
 1
1 -
2
-
3
-
4
-
5
-
6
-
7
-
8
-
9
-
10
-
11
-
12
-
13
-
14
-
15
-
16
-
17
-
18
-
19
-
20
-
21
-
22
-
23
-
24
-
25
-
26
-
27
-
28
-
29
-
30
-
31
-
32
-
33
-
34
-
35
-
36
-
37
-
38
-
39
-
40
-
41
-
42
-
 43
43 -
 44
44 -
 45
45 -
 46
46 -
 47
47 -
 48
48 -
 49
49 -
 50
50 -
 51
51 -
 52
52 -
 53
53 -
 54
54 -
 55
55 -
 56
56 -
 57
57 -
 58
58 -
 59
59 -
 60
60 -
 61
61 -
 62
62 -
 63
63 -
64
-
65
-
66
-
67
-
68
-
69
-
70
-
71
-
72
-
73
-
74
-
75
-
76
-
77
-
78
-
79
-
80
-
81
-
82
-
83
-
84
-
85
-
86
-
87
-
88
-
89
-
90
-
91
-
92
-
93
-
94
-
95
-
96
-
97
-
98
-
99
-
100
-
101
-
102
-
103
-
104
-
105
-
106
-
107
-
108
-
109
-
110
-
111
-
112
-
113
-
114
-
115
-
116
-
117
-
118
-
119
-
120
-
121
-
122
-
123
-
124
-
125
-
126
 |
 |

41
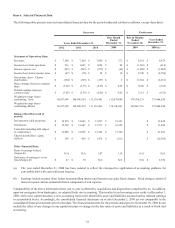
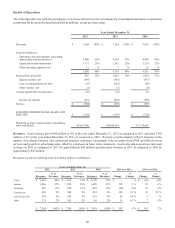
Certain prior year amounts have been reclassified to conform with the 2012 presentation, including the reflection of revenues
earned from customers residing in multi-dwelling residential structures from commercial revenues to video and Internet revenues.
See “Part I. Item 1. Business — Products and Services” for definitions of customers and ARPU discussed below.
Video revenues consist primarily of revenues from basic and digital video services provided to our non-commercial customers,
as well as franchise fees, equipment rental and video installation revenue. Average monthly video revenue per residential basic
video customer, measured on an annual basis, has increased from $69 in 2010 to $72 in 2011 and $74 in 2012 as a result of price
increases, incremental revenues from DVR and HD television services and declines in the number of residential basic video
customers. Residential basic video customers decreased by 155,000 and 182,000 customers in 2012 and 2011, respectively, or
152,000 and 210,000 customers in 2012 and 2011, respectively, after giving effect to asset sales and acquisitions. The changes
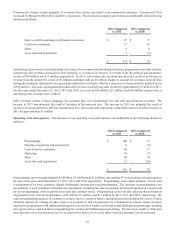
in video revenues are attributable to the following (dollars in millions):
2012 compared
to 2011 2011 compared
to 2010
Decrease in basic video customers $ (89) $ (113)
Decrease in premium, OnDemand and pay-per-view (39)(21)
Incremental video services and price adjustments 115 74
Asset sales and acquisitions 13 (30)
$ — $ (90)
Average monthly Internet revenue per Internet customer, measured on an annual basis, has remained constant at $42 in 2010, 2011
and 2012. Residential Internet customers grew by 293,000 and 246,000 customers in 2012 and 2011, respectively, or 295,000
and 229,000 customers in 2012 and 2011, respectively, after giving effect to asset sales and acquisitions. The increases in Internet
revenues from our residential customers are attributable to the following (dollars in millions):
2012 compared
to 2011 2011 compared
to 2010
Increase in residential Internet customers $ 136 $ 96
Service level changes and price adjustments 17 11
Asset sales and acquisitions 5 (8)
$ 158 $ 99
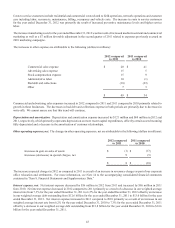
Average monthly telephone revenue per telephone customer, measured on an annual basis, has decreased from $42 in 2010 to $41
in 2011 to $37 in 2012. The decrease is due to value-based pricing and revenue allocation in multi-product packages. Residential
telephone customers grew by 123,000 and 74,000 customers in 2012 and 2011, respectively, or 122,000 and 69,000 customers in
2012 and 2011, respectively, after giving effect to asset sales and acquisitions. The increases in telephone revenues from our
residential customers are attributable to the following (dollars in millions):
2012 compared
to 2011 2011 compared
to 2010
Price adjustments and service level changes $ (71) $ (15)
Increase in residential telephone customers 40 50
Asset sales and acquisitions 1 —
$(30) $ 35