Charter 2012 Annual Report Download - page 56
Download and view the complete annual report
Please find page 56 of the 2012 Charter annual report below. You can navigate through the pages in the report by either clicking on the pages listed below, or by using the keyword search tool below to find specific information within the annual report.-
 1
1 -
2
-
3
-
4
-
5
-
6
-
7
-
8
-
9
-
10
-
11
-
12
-
13
-
14
-
15
-
16
-
17
-
18
-
19
-
20
-
21
-
22
-
23
-
24
-
25
-
26
-
27
-
28
-
29
-
30
-
31
-
32
-
33
-
34
-
35
-
36
-
37
-
38
-
39
-
40
-
41
-
42
-
43
-
44
-
45
-
 46
46 -
 47
47 -
 48
48 -
 49
49 -
 50
50 -
 51
51 -
 52
52 -
 53
53 -
 54
54 -
 55
55 -
 56
56 -
 57
57 -
 58
58 -
 59
59 -
 60
60 -
 61
61 -
 62
62 -
 63
63 -
 64
64 -
 65
65 -
 66
66 -
67
-
68
-
69
-
70
-
71
-
72
-
73
-
74
-
75
-
76
-
77
-
78
-
79
-
80
-
81
-
82
-
83
-
84
-
85
-
86
-
87
-
88
-
89
-
90
-
91
-
92
-
93
-
94
-
95
-
96
-
97
-
98
-
99
-
100
-
101
-
102
-
103
-
104
-
105
-
106
-
107
-
108
-
109
-
110
-
111
-
112
-
113
-
114
-
115
-
116
-
117
-
118
-
119
-
120
-
121
-
122
-
123
-
124
-
125
-
126
 |
 |

44
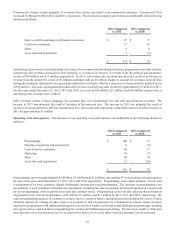
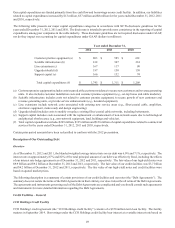
Loss on extinguishment of debt. Loss on extinguishment of debt consists of the following for the years ended December 31,
2012, 2011 and 2010 (dollars in millions):
Year ended December 31,
2012 2011 2010
Charter Operating credit amendment / prepayments $ (92) $ (120) $ (51)
CCH II notes redemptions 46 (6) —
Charter Operating notes repurchases (9)(17)(17)
CCO Holdings notes repurchases / exchanges — — (17)
$(55) $ (143) $ (85)
The gains and losses on extinguishment of debt primarily represent premiums paid to redeem debt and noncash write-offs of
discounts and premiums recognized as a part of the application of fresh start accounting upon emergence from bankruptcy in 2009.
For more information, see Note 7 to the accompanying consolidated financial statements contained in “Item 8. Financial Statements
and Supplementary Data.”
Income tax expense. Income tax expense of $257 million, $299 million and $295 million was recognized for the years ended
December 31, 2012, 2011 and 2010, respectively, primarily through increases in deferred tax liabilities related to our investment
in Charter Holdco and certain of our indirect subsidiaries, in addition to $7 million, $9 million and $8 million of current federal
and state income tax expense, respectively. Income tax expense for the year ended December 31, 2011 included an $8 million
expense for a state tax law change. Income tax expense for the year ended December 31, 2010 included $23 million expense
related primarily to changes in estimates on the 2009 tax provision, a $16 million expense related to asset sales occurring in 2010
and a $69 million benefit related to the February 8, 2010 Charter Holdco partnership interest exchange.
Net loss. We incurred net loss of $304 million, $369 million and $237 million for the years ended December 31, 2012, 2011 and
2010, respectively, primarily as a result of the factors described above.
Loss per common share. During 2012 and 2011, net loss per common share decreased by $0.34 and increased by $1.30, respectively,
as a result of the factors described above offset by a decrease in our weighted average common shares outstanding as a result of
share repurchases in 2011.
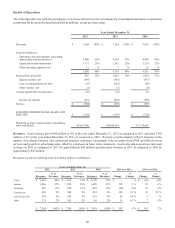
Use of Adjusted EBITDA and Free Cash Flow
We use certain measures that are not defined by GAAP to evaluate various aspects of our business. Adjusted EBITDA and free
cash flow are non-GAAP financial measures and should be considered in addition to, not as a substitute for, net loss and net cash
flows from operating activities reported in accordance with GAAP. These terms, as defined by us, may not be comparable to
similarly titled measures used by other companies. Adjusted EBITDA and free cash flow are reconciled to net loss and net cash
flows from operating activities, respectively, below.
Adjusted EBITDA is defined as net loss plus net interest expense, income taxes, depreciation and amortization, stock compensation
expense, loss on extinguishment of debt and other operating expenses, such as special charges and (gain) loss on sale or retirement
of assets. As such, it eliminates the significant non-cash depreciation and amortization expense that results from the capital-
intensive nature of our businesses as well as other non-cash or special items, and is unaffected by our capital structure or investment
activities. Adjusted EBITDA is used by management and Charter’s board of directors to evaluate the performance of our business.
However, this measure is limited in that it does not reflect the periodic costs of certain capitalized tangible and intangible assets
used in generating revenues and our cash cost of financing. Management evaluates these costs through other financial measures.
Free cash flow is defined as net cash flows from operating activities, less capital expenditures and changes in accrued expenses
related to capital expenditures.
We believe that Adjusted EBITDA and free cash flow provide information useful to investors in assessing our performance and
our ability to service our debt, fund operations and make additional investments with internally generated funds. In addition,
Adjusted EBITDA generally correlates to the leverage ratio calculation under our credit facilities or outstanding notes to determine
compliance with the covenants contained in the facilities and notes (all such documents have been previously filed with the United