Charter 2012 Annual Report Download - page 61
Download and view the complete annual report
Please find page 61 of the 2012 Charter annual report below. You can navigate through the pages in the report by either clicking on the pages listed below, or by using the keyword search tool below to find specific information within the annual report.-
 1
1 -
2
-
3
-
4
-
5
-
6
-
7
-
8
-
9
-
10
-
11
-
12
-
13
-
14
-
15
-
16
-
17
-
18
-
19
-
20
-
21
-
22
-
23
-
24
-
25
-
26
-
27
-
28
-
29
-
30
-
31
-
32
-
33
-
34
-
35
-
36
-
37
-
38
-
39
-
40
-
41
-
42
-
43
-
44
-
45
-
46
-
47
-
48
-
49
-
50
-
 51
51 -
 52
52 -
 53
53 -
 54
54 -
 55
55 -
 56
56 -
 57
57 -
 58
58 -
 59
59 -
 60
60 -
 61
61 -
 62
62 -
 63
63 -
 64
64 -
 65
65 -
 66
66 -
 67
67 -
 68
68 -
 69
69 -
 70
70 -
 71
71 -
72
-
73
-
74
-
75
-
76
-
77
-
78
-
79
-
80
-
81
-
82
-
83
-
84
-
85
-
86
-
87
-
88
-
89
-
90
-
91
-
92
-
93
-
94
-
95
-
96
-
97
-
98
-
99
-
100
-
101
-
102
-
103
-
104
-
105
-
106
-
107
-
108
-
109
-
110
-
111
-
112
-
113
-
114
-
115
-
116
-
117
-
118
-
119
-
120
-
121
-
122
-
123
-
124
-
125
-
126
 |
 |

49
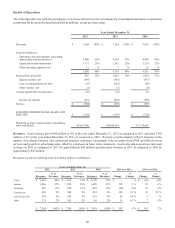
Our capital expenditures are funded primarily from free cash flow and borrowings on our credit facility. In addition, our liabilities
related to capital expenditures increased by $13 million, $57 million and $8 million for the years ended December 31, 2012, 2011
and 2010, respectively.
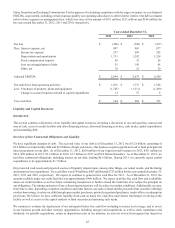
The following table presents our major capital expenditures categories in accordance with NCTA disclosure guidelines for the
years ended December 31, 2012, 2011 and 2010. The disclosure is intended to provide more consistency in the reporting of capital
expenditures among peer companies in the cable industry. These disclosure guidelines are not required disclosures under GAAP,
nor do they impact our accounting for capital expenditures under GAAP (dollars in millions):
Year ended December 31,
2012 2011 2010
Customer premise equipment (a) $ 803 $ 585 $ 601
Scalable infrastructure (b) 412 347 314
Line extensions (c) 167 117 90
Upgrade/rebuild (d) 197 130 130
Support capital (e) 166 132 74
Total capital expenditures (f) $ 1,745 $ 1,311 $ 1,209
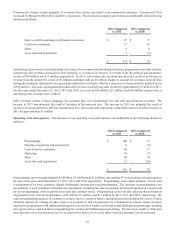
(a) Customer premise equipment includes costs incurred at the customer residence to secure new customers and revenue generating
units. It also includes customer installation costs and customer premise equipment (e.g., set-top boxes and cable modems).
(b) Scalable infrastructure includes costs not related to customer premise equipment, to secure growth of new customers and
revenue generating units, or provide service enhancements (e.g., headend equipment).
(c) Line extensions include network costs associated with entering new service areas (e.g., fiber/coaxial cable, amplifiers,
electronic equipment, make-ready and design engineering).
(d) Upgrade/rebuild includes costs to modify or replace existing fiber/coaxial cable networks, including betterments.
(e) Support capital includes costs associated with the replacement or enhancement of non-network assets due to technological
and physical obsolescence (e.g., non-network equipment, land, buildings and vehicles).
(f) Total capital expenditures includes $269 million, $195 million and $138 million of capital expenditures related to commercial
services for the years ended December 31, 2012, 2011 and 2010, respectively.
Certain prior period amounts have been reclassified to conform with the 2012 presentation.
Description of Our Outstanding Debt
Overview
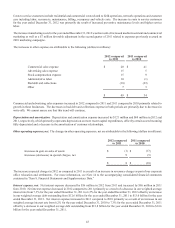
As of December 31, 2012 and 2011, the blended weighted average interest rate on our debt was 6.0% and 7.1%, respectively. The
interest rate on approximately 87% and 82% of the total principal amount of our debt was effectively fixed, including the effects
of our interest rate hedge agreements as of December 31, 2012 and 2011, respectively. The fair value of our high-yield notes was
$9.9 billion and $9.2 billion at December 31, 2012 and 2011, respectively. The fair value of our credit facilities was $3.7 billion
and $4.2 billion at December 31, 2012 and 2011, respectively. The fair value of our high-yield notes and credit facilities were
based on quoted market prices.
The following description is a summary of certain provisions of our credit facilities and our notes (the “Debt Agreements”). The
summary does not restate the terms of the Debt Agreements in their entirety, nor does it describe all terms of the Debt Agreements.
The agreements and instruments governing each of the Debt Agreements are complicated and you should consult such agreements
and instruments for more detailed information regarding the Debt Agreements.
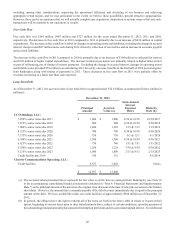
Credit Facilities – General
CCO Holdings Credit Facility
CCO Holdings' credit agreement (the “CCO Holdings credit facility”) consists of a $350 million term loan facility. The facility
matures in September 2014. Borrowings under the CCO Holdings credit facility bear interest at a variable interest rate based on