Charter 2012 Annual Report Download - page 57
Download and view the complete annual report
Please find page 57 of the 2012 Charter annual report below. You can navigate through the pages in the report by either clicking on the pages listed below, or by using the keyword search tool below to find specific information within the annual report.-
 1
1 -
2
-
3
-
4
-
5
-
6
-
7
-
8
-
9
-
10
-
11
-
12
-
13
-
14
-
15
-
16
-
17
-
18
-
19
-
20
-
21
-
22
-
23
-
24
-
25
-
26
-
27
-
28
-
29
-
30
-
31
-
32
-
33
-
34
-
35
-
36
-
37
-
38
-
39
-
40
-
41
-
42
-
43
-
44
-
45
-
46
-
 47
47 -
 48
48 -
 49
49 -
 50
50 -
 51
51 -
 52
52 -
 53
53 -
 54
54 -
 55
55 -
 56
56 -
 57
57 -
 58
58 -
 59
59 -
 60
60 -
 61
61 -
 62
62 -
 63
63 -
 64
64 -
 65
65 -
 66
66 -
 67
67 -
68
-
69
-
70
-
71
-
72
-
73
-
74
-
75
-
76
-
77
-
78
-
79
-
80
-
81
-
82
-
83
-
84
-
85
-
86
-
87
-
88
-
89
-
90
-
91
-
92
-
93
-
94
-
95
-
96
-
97
-
98
-
99
-
100
-
101
-
102
-
103
-
104
-
105
-
106
-
107
-
108
-
109
-
110
-
111
-
112
-
113
-
114
-
115
-
116
-
117
-
118
-
119
-
120
-
121
-
122
-
123
-
124
-
125
-
126
 |
 |

45
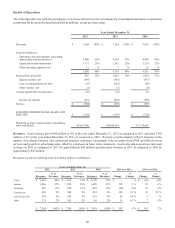
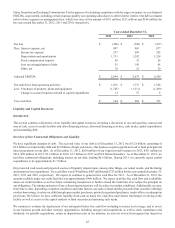
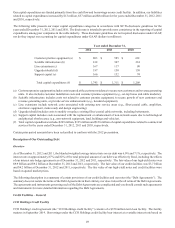
States Securities and Exchange Commission). For the purpose of calculating compliance with leverage covenants, we use Adjusted
EBITDA, as presented, excluding certain expenses paid by our operating subsidiaries to other Charter entities. Our debt covenants
refer to these expenses as management fees, which fees were in the amount of $191 million, $151 million and $144 million for
the years ended December 31, 2012, 2011 and 2010, respectively.
Years ended December 31,
2012 2011 2010
Net loss $ (304) $ (369) $ (237)
Plus: Interest expense, net 907 963 877
Income tax expense 257 299 295
Depreciation and amortization 1,713 1,592 1,524
Stock compensation expense 50 35 26
Loss on extinguishment of debt 55 143 85
Other, net 16 12 29
Adjusted EBITDA $ 2,694 $ 2,675 $ 2,599
Net cash flows from operating activities $ 1,876 $ 1,737 $ 1,928
Less: Purchases of property, plant and equipment (1,745)(1,311)(1,209)
Change in accrued expenses related to capital expenditures 13 57 8
Free cash flow $ 144 $ 483 $ 727
Liquidity and Capital Resources
Introduction
This section contains a discussion of our liquidity and capital resources, including a discussion of our cash position, sources and
uses of cash, access to credit facilities and other financing sources, historical financing activities, cash needs, capital expenditures
and outstanding debt.
Overview of Our Contractual Obligations and Liquidity
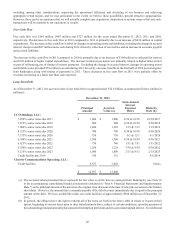
We have significant amounts of debt. The accreted value of our debt as of December 31, 2012 was $12.8 billion, consisting of
$3.6 billion of credit facility debt and $9.2 billion of high-yield notes. Our business requires significant cash to fund principal and
interest payments on our debt. As of December 31, 2012, $260 million of our long-term debt matures in 2013, $411 million in
2014, $98 million in 2015, $1.6 billion in 2016, $1.7 billion in 2017 and $9.0 billion thereafter. As of December 31, 2012, we
had other contractual obligations, including interest on our debt, totaling $6.6 billion. During 2013, we currently expect capital
expenditures to be approximately $1.7 billion.
Our projected cash needs and projected sources of liquidity depend upon, among other things, our actual results, and the timing
and amount of our expenditures. Free cash flow was $144 million, $483 million and $727 million for the years ended December 31,
2012, 2011 and 2010, respectively. We expect to continue to generate free cash flow for 2013. As of December 31, 2012, the
amount available under our credit facilities was approximately $960 million. We expect to utilize free cash flow and availability
under our credit facilities as well as future refinancing transactions to further extend the maturities of or reduce the principal on
our obligations. The timing and terms of any refinancing transactions will be subject to market conditions. Additionally, we may,
from time to time, depending on market conditions and other factors, use cash on hand and the proceeds from securities offerings
or other borrowings, to retire our debt through open market purchases, privately negotiated purchases, tender offers, or redemption
provisions. We believe we have sufficient liquidity from cash on hand, free cash flow and Charter Operating's revolving credit
facility as well as access to the capital markets to fund our projected operating cash needs.
We continue to evaluate the deployment of our anticipated future free cash flow including to reduce our leverage, and to invest
in our business growth and other strategic opportunities, including mergers and acquisitions as well as stock repurchases and
dividends. As possible acquisitions, swaps or dispositions arise in our industry, we actively review them against our objectives