Charter 2012 Annual Report Download - page 8
Download and view the complete annual report
Please find page 8 of the 2012 Charter annual report below. You can navigate through the pages in the report by either clicking on the pages listed below, or by using the keyword search tool below to find specific information within the annual report.-
 1
1 -
 2
2 -
 3
3 -
 4
4 -
 5
5 -
 6
6 -
 7
7 -
 8
8 -
 9
9 -
 10
10 -
 11
11 -
 12
12 -
 13
13 -
 14
14 -
 15
15 -
 16
16 -
 17
17 -
 18
18 -
 19
19 -
20
-
21
-
22
-
23
-
24
-
25
-
26
-
27
-
28
-
29
-
30
-
31
-
32
-
33
-
34
-
35
-
36
-
37
-
38
-
39
-
40
-
41
-
42
-
43
-
44
-
45
-
46
-
47
-
48
-
49
-
50
-
51
-
52
-
53
-
54
-
55
-
56
-
57
-
58
-
59
-
60
-
61
-
62
-
63
-
64
-
65
-
66
-
67
-
68
-
69
-
70
-
71
-
72
-
73
-
74
-
75
-
76
-
77
-
78
-
79
-
80
-
81
-
82
-
83
-
84
-
85
-
86
-
87
-
88
-
89
-
90
-
91
-
92
-
93
-
94
-
95
-
96
-
97
-
98
-
99
-
100
-
101
-
102
-
103
-
104
-
105
-
106
-
107
-
108
-
109
-
110
-
111
-
112
-
113
-
114
-
115
-
116
-
117
-
118
-
119
-
120
-
121
-
122
-
123
-
124
-
125
-
126
 |
 |

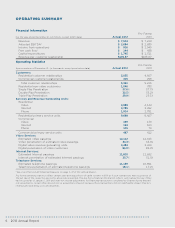
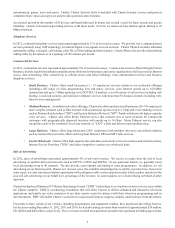
Financial Information
For the year ended December 31, (in millions, except ARPU data) Actual 2012
Pro Forma
2011
Revenue
Adjusted EBITDA*
Income from operations
Free cash flow*
Capital expenditures
Revenue per customer relationship
Operating Statistics
Approximate as of December 31, (in thousands, except penetration data) Actual 2012
Pro Forma
2011
Customers:
Residential customer relationships
Commercial customer relationships
Total customer relationships
Residential non-video customers
Single Play Penetration %
Double Play Penetration %
Triple Play Penetration %
Services and Revenue Generating Units:
Residential
Video
Internet
Phone
Residential primary service units
Commercial
Video
Internet
Phone
Commercial primary service units
Video Services:
Estimated video passings
Video penetration of estimated video passings %
Digital video revenue generating units
Digital penetration of video customers %
Internet Services:
Estimated Internet passings
Internet penetration of estimated Internet passings %
Telephone Services:
Estimated telephone passings
Telephone penetration of estimated telephone passings %
*See Use of Non-GAAP Financial Measures on page F-47 of this Annual Report.
Pro forma operating statistics reflect certain sales and acquisitions of cable systems in 2011 as if such transactions had occurred as of
the last day of the respective period for all periods presented. The pro forma financial information reflects such transactions as if they
had occurred as of January 1, 2011 and does not include adjustments for financing transactions completed by Charter during the peri-
ods presented or certain other dispositions or acquisitions of assets because those transactions did not significantly impact Charter’s
revenue and operating costs and expenses.
2012 Annual Report6
OPERATING SUMMARY