Charter 2012 Annual Report Download - page 99
Download and view the complete annual report
Please find page 99 of the 2012 Charter annual report below. You can navigate through the pages in the report by either clicking on the pages listed below, or by using the keyword search tool below to find specific information within the annual report.-
 1
1 -
2
-
3
-
4
-
5
-
6
-
7
-
8
-
9
-
10
-
11
-
12
-
13
-
14
-
15
-
16
-
17
-
18
-
19
-
20
-
21
-
22
-
23
-
24
-
25
-
26
-
27
-
28
-
29
-
30
-
31
-
32
-
33
-
34
-
35
-
36
-
37
-
38
-
39
-
40
-
41
-
42
-
43
-
44
-
45
-
46
-
47
-
48
-
49
-
50
-
51
-
52
-
53
-
54
-
55
-
56
-
57
-
58
-
59
-
60
-
61
-
62
-
63
-
64
-
65
-
66
-
67
-
68
-
69
-
70
-
71
-
72
-
73
-
74
-
75
-
76
-
77
-
78
-
79
-
80
-
81
-
82
-
83
-
84
-
85
-
86
-
87
-
88
-
 89
89 -
 90
90 -
 91
91 -
 92
92 -
 93
93 -
 94
94 -
 95
95 -
 96
96 -
 97
97 -
 98
98 -
 99
99 -
 100
100 -
 101
101 -
 102
102 -
 103
103 -
 104
104 -
 105
105 -
 106
106 -
 107
107 -
 108
108 -
 109
109 -
110
-
111
-
112
-
113
-
114
-
115
-
116
-
117
-
118
-
119
-
120
-
121
-
122
-
123
-
124
-
125
-
126
 |
 |

CHARTER COMMUNICATIONS, INC. AND SUBSIDIARIES
NOTES TO CONSOLIDATED FINANCIAL STATEMENTS
DECEMBER 31, 2012, 2011 AND 2010
(dollars in millions, except share or per share data or where indicated)
F- 24
The carrying amounts of cash and cash equivalents, receivables, payables and other current assets and liabilities approximate fair
value because of the short maturity of those instruments.
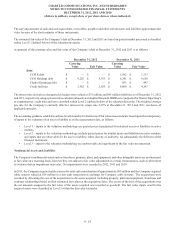
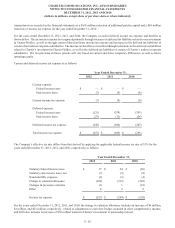
The estimated fair value of the Company’s debt at December 31, 2012 and 2011 are based on quoted market prices and is classified
within Level 1 (defined below) of the valuation hierarchy.
A summary of the carrying value and fair value of the Company’s debt at December 31, 2012 and 2011 is as follows:
December 31, 2012 December 31, 2011
Carrying
Value Fair Value Carrying
Value Fair Value
Debt
CCH II debt $ — $ — $ 1,692 $ 1,713
CCO Holdings debt $ 9,226 $ 9,933 $ 6,241 $ 6,630
Charter Operating debt $ — $ — $ 833 $ 847
Credit facilities $ 3,582 $ 3,695 $ 4,090 $ 4,193
The interest rate derivatives designated as hedges were valued as $75 million and $65 million liabilities as of December 31, 2012
and 2011, respectively, using a present value calculation based on an implied forward LIBOR curve (adjusted for Charter Operating’s
or counterparties’ credit risk) and were classified within Level 2 (defined below) of the valuation hierarchy. The weighted average
pay rate for the Company’s currently effective interest rate swaps was 2.25% at December 31, 2012 and 2011 (exclusive of
applicable spreads).
The accounting guidance establishes a three-level hierarchy for disclosure of fair value measurements, based upon the transparency
of inputs to the valuation of an asset or liability as of the measurement date, as follows:
• Level 1 – inputs to the valuation methodology are quoted prices (unadjusted) for identical assets or liabilities in active
markets.
• Level 2 – inputs to the valuation methodology include quoted prices for similar assets and liabilities in active markets,
and inputs that are observable for the asset or liability, either directly or indirectly, for substantially the full term of the
financial instrument.
• Level 3 – inputs to the valuation methodology are unobservable and significant to the fair value measurement.
Nonfinancial Assets and Liabilities
The Company’s nonfinancial assets such as franchises, property, plant, and equipment, and other intangible assets are not measured
at fair value on a recurring basis; however they are subject to fair value adjustments in certain circumstances, such as when there
is evidence that an impairment may exist. No impairments were recorded in 2012, 2011 and 2010.
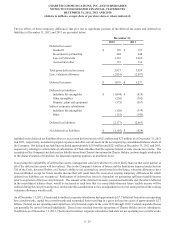
In 2011, the Company acquired cable systems for total cash consideration of approximately $89 million and the Company acquired
cable systems valued at $16 million in a non-cash transaction in exchange for Company cable systems. The acquisitions were
recorded by allocating the cost of the acquisitions to the assets acquired, including property, plant and equipment, franchises and
customer relationships based on their estimated fair values at the acquisition dates. The excess of the cost of the acquisitions over
the net amounts assigned to the fair value of the assets acquired was recorded as goodwill. The fair value inputs used for the
acquired assets were classified as Level 3 within the fair value hierarchy.