Charter 2012 Annual Report Download - page 58
Download and view the complete annual report
Please find page 58 of the 2012 Charter annual report below. You can navigate through the pages in the report by either clicking on the pages listed below, or by using the keyword search tool below to find specific information within the annual report.-
 1
1 -
2
-
3
-
4
-
5
-
6
-
7
-
8
-
9
-
10
-
11
-
12
-
13
-
14
-
15
-
16
-
17
-
18
-
19
-
20
-
21
-
22
-
23
-
24
-
25
-
26
-
27
-
28
-
29
-
30
-
31
-
32
-
33
-
34
-
35
-
36
-
37
-
38
-
39
-
40
-
41
-
42
-
43
-
44
-
45
-
46
-
47
-
 48
48 -
 49
49 -
 50
50 -
 51
51 -
 52
52 -
 53
53 -
 54
54 -
 55
55 -
 56
56 -
 57
57 -
 58
58 -
 59
59 -
 60
60 -
 61
61 -
 62
62 -
 63
63 -
 64
64 -
 65
65 -
 66
66 -
 67
67 -
 68
68 -
69
-
70
-
71
-
72
-
73
-
74
-
75
-
76
-
77
-
78
-
79
-
80
-
81
-
82
-
83
-
84
-
85
-
86
-
87
-
88
-
89
-
90
-
91
-
92
-
93
-
94
-
95
-
96
-
97
-
98
-
99
-
100
-
101
-
102
-
103
-
104
-
105
-
106
-
107
-
108
-
109
-
110
-
111
-
112
-
113
-
114
-
115
-
116
-
117
-
118
-
119
-
120
-
121
-
122
-
123
-
124
-
125
-
126
 |
 |

46
including, among other considerations, improving the operational efficiency and clustering of our business and achieving
appropriate return targets, and we may participate to the extent we believe these possibilities present attractive opportunities.
However, there can be no assurance that we will actually complete any acquisition, disposition or system swap or that any such
transactions will be material to our operations or results.
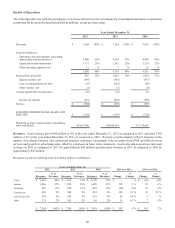
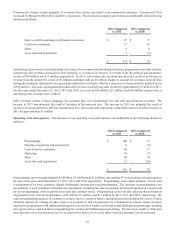
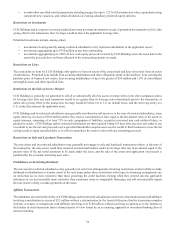
Free Cash Flow
Free cash flow was $144 million, $483 million and $727 million for the years ended December 31, 2012, 2011 and 2010,
respectively. The decrease in free cash flow in 2012 compared to 2011 is primarily due to an increase of $434 million in capital
expenditures. The decrease in free cash flow is offset by changes in operating assets and liabilities, excluding the change in accrued
interest, that provided $87 million more cash during 2012 driven by collection of receivables and an increase in accounts payable
and accrued liabilities.
The decrease in free cash flow in 2011 compared to 2010 is primarily due to an increase of $164 million in cash paid for interest
and $102 million of higher capital expenditures. The increase in interest payments was primarily related to higher interest rates
as part of refinancing, net of timing of interest payments. Excluding the change in accrued interest, changes in operating assets
and liabilities also provided $59 million less cash during 2011 driven by one-time benefits in the first half of 2010 post emergence
from bankruptcy along with timing of payments in 2011. These decreases in free cash flow in 2011 were partially offset by
revenues increasing at a faster rate than cash expenses.
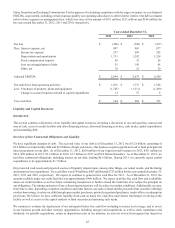
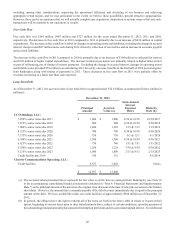
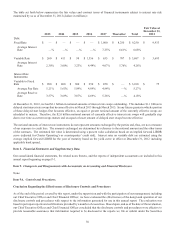
Long-Term Debt
As of December 31, 2012, the accreted value of our total debt was approximately $12.8 billion, as summarized below (dollars in
millions):
December 31, 2012
Principal
Amount Accreted
Value (a)
Semi-Annual
Interest
Payment
Dates Maturity
Date (b)
CCO Holdings, LLC:
7.250% senior notes due 2017 $ 1,000 $ 1,000 4/30 & 10/30 10/30/2017
7.875% senior notes due 2018 900 900 4/30 & 10/30 4/30/2018
7.000% senior notes due 2019 1,400 1,392 1/15 & 7/15 1/15/2019
8.125% senior notes due 2020 700 700 4/30 & 10/30 4/30/2020
7.375% senior notes due 2020 750 750 6/1 & 12/1 6/1/2020
6.500% senior notes due 2021 1,500 1,500 4/30 & 10/30 4/30/2021
6.625% senior notes due 2022 750 746 1/31 & 7/31 1/31/2022
5.250% senior notes due 2022 1,250 1,238 3/30 & 9/30 9/30/2022
5.125% senior notes due 2023 1,000 1,000 2/15 & 8/15 2/15/2023
Credit facility due 2014 350 332 9/6/2014
Charter Communications Operating, LLC:
Credit facilities 3,337 3,250 Varies
$ 12,937 $ 12,808
(a) The accreted values presented above represent the fair value as of the date we emerged from Bankruptcy (see Note 18
to the accompanying consolidated financial statements contained in “Item 8. Financial Statements and Supplementary
Data.”) or the principal amount of the notes less the original issue discount at the time of sale, plus accretion to the balance
sheet dates. However, the amount that is currently payable if the debt becomes immediately due is equal to the principal
amount of the debt. We have availability under our credit facilities of approximately $960 million as of December 31,
2012.
(b) In general, the obligors have the right to redeem all of the notes set forth in the above table in whole or in part at their
option, beginning at various times prior to their stated maturity dates, subject to certain conditions, upon the payment of
the outstanding principal amount (plus a specified redemption premium) and all accrued and unpaid interest. For additional