Lowe's 2014 Annual Report Download - page 26
Download and view the complete annual report
Please find page 26 of the 2014 Lowe's annual report below. You can navigate through the pages in the report by either clicking on the pages listed below, or by using the keyword search tool below to find specific information within the annual report.-
 1
1 -
2
-
3
-
4
-
5
-
6
-
7
-
8
-
9
-
10
-
11
-
12
-
13
-
14
-
15
-
 16
16 -
 17
17 -
 18
18 -
 19
19 -
 20
20 -
 21
21 -
 22
22 -
 23
23 -
 24
24 -
 25
25 -
 26
26 -
 27
27 -
 28
28 -
 29
29 -
 30
30 -
 31
31 -
 32
32 -
 33
33 -
 34
34 -
 35
35 -
 36
36 -
37
-
38
-
39
-
40
-
41
-
42
-
43
-
44
-
45
-
46
-
47
-
48
-
49
-
50
-
51
-
52
-
53
-
54
-
55
-
56
-
57
-
58
-
59
-
60
-
61
-
62
-
63
-
64
-
65
-
66
-
67
-
68
-
69
-
70
-
71
-
72
-
73
-
74
-
75
-
76
-
77
-
78
-
79
-
80
-
81
-
82
-
83
-
84
-
85
-
86
-
87
-
88
-
89
-
90
-
91
-
92
-
93
-
94
 |
 |
Item 7 - Management's Discussion and Analysis of Financial Condition and Results of Operations
The following discussion and analysis summarizes the significant factors affecting our consolidated operating results, financial
condition, liquidity and capital resources during the three-year period ended January 30, 2015 (our fiscal years 2014, 2013 and
2012). Unless otherwise noted, all references herein for the years 2014, 2013 and 2012 represent the fiscal years ended
January 30, 2015, January 31, 2014 and February 1, 2013, respectively. We intend for this discussion to provide the reader
with information that will assist in understanding our financial statements, the changes in certain key items in those financial
statements from year to year, and the primary factors that accounted for those changes, as well as how certain accounting
principles affect our financial statements. This discussion should be read in conjunction with our consolidated financial
statements and notes to the consolidated financial statements included in this Annual Report on Form 10-K that have been
prepared in accordance with accounting principles generally accepted in the United States of America. This discussion and
analysis is presented in seven sections:
• Executive Overview
• Operations
• Lowe’s Business Outlook
• Financial Condition, Liquidity and Capital Resources
• Off-Balance Sheet Arrangements
• Contractual Obligations and Commercial Commitments
• Critical Accounting Policies and Estimates
EXECUTIVE OVERVIEW
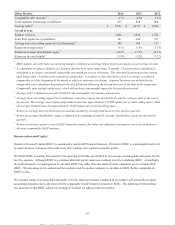
Net earnings increased 18.0% to $2.7 billion during fiscal year 2014, and diluted earnings per share increased 26.6% to $2.71.
Net sales for 2014 were $56.2 billion, a 5.3% increase over fiscal year 2013. Comparable sales increased 4.3%, driven by a
comparable average ticket increase of 2.4% and a comparable transaction increase of 1.8%.
For 2014, cash flows from operating activities were approximately $4.9 billion, with $880 million used for capital
expenditures. Our strong financial position and positive cash flows allowed us to deliver on our commitment to return excess
cash to shareholders. During 2014, the company repurchased 74.7 million shares of stock for $3.9 billion and paid $822
million in dividends.
Throughout 2014, we continued to build momentum as we further optimized our business model. We were focused on three
priorities to drive further top line growth including our enhanced Sales & Operations Planning process, building on our
customer experience design capabilities, and improving our relevance with the Pro customer. In addition, in order to provide
not just the products, but also the services, information, and advice to help our customers improve their homes, we are
continuing to transform from a single-channel, home improvement retailer to an omni-channel home improvement company.
This allows us to sell products from a store, online, on-site, or through one of our contact centers and fulfill orders in the most
convenient manner for our customers.
Through our Sales & Operations Planning process, we have improved seasonal planning, including the cadence of product
introductions, promotions and staffing. Our Sales & Operations process is anchored in the customer mindset for the season.
The process ensures collaboration from all functions, including logistics, merchandising and marketing, to make certain we
have relevant products available to customers at the right time and those products are effectively advertised and strategically
promoted to drive customer traffic.
In addition, during 2014, we continued to build customer experience design capabilities. We now have a dedicated customer
experience design team that coordinates the creation of customer experiences that encompass the entire project from
inspiration, to purchase, to fulfillment. These experiences are rooted in research around customers' shopping preferences and
mindset about specific home improvement projects. Any experience we design has to meet three critical criteria: it must be
16
This proof is printed at 96% of original size
This line represents final trim and will not print