Lowe's 2014 Annual Report Download - page 44
Download and view the complete annual report
Please find page 44 of the 2014 Lowe's annual report below. You can navigate through the pages in the report by either clicking on the pages listed below, or by using the keyword search tool below to find specific information within the annual report.-
 1
1 -
2
-
3
-
4
-
5
-
6
-
7
-
8
-
9
-
10
-
11
-
12
-
13
-
14
-
15
-
16
-
17
-
18
-
19
-
20
-
21
-
22
-
23
-
24
-
25
-
26
-
27
-
28
-
29
-
30
-
31
-
32
-
33
-
 34
34 -
 35
35 -
 36
36 -
 37
37 -
 38
38 -
 39
39 -
 40
40 -
 41
41 -
 42
42 -
 43
43 -
 44
44 -
 45
45 -
 46
46 -
 47
47 -
 48
48 -
 49
49 -
 50
50 -
 51
51 -
 52
52 -
 53
53 -
 54
54 -
55
-
56
-
57
-
58
-
59
-
60
-
61
-
62
-
63
-
64
-
65
-
66
-
67
-
68
-
69
-
70
-
71
-
72
-
73
-
74
-
75
-
76
-
77
-
78
-
79
-
80
-
81
-
82
-
83
-
84
-
85
-
86
-
87
-
88
-
89
-
90
-
91
-
92
-
93
-
94
 |
 |

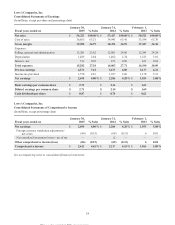
Lowe's Companies, Inc.
Consolidated Statements of Earnings
(In millions, except per share and percentage data)
Fiscal years ended on
January 30,
2015 % Sales
January 31,
2014 % Sales
February 1,
2013 % Sales
Net sales $ 56,223
100.00 % $ 53,417
100.00 % $ 50,521
100.00 %
Cost of sales 36,665
65.21
34,941
65.41
33,194
65.70
Gross margin 19,558
34.79
18,476
34.59
17,327
34.30
Expenses:
Selling, general and administrative 13,281
23.62
12,865
24.08
12,244
24.24
Depreciation 1,485
2.64
1,462
2.74
1,523
3.01
Interest - net 516
0.92
476
0.89
423
0.84
Total expenses 15,282
27.18
14,803
27.71
14,190
28.09
Pre-tax earnings 4,276
7.61
3,673
6.88
3,137
6.21
Income tax provision 1,578
2.81
1,387
2.60
1,178
2.33
Net earnings $ 2,698
4.80 % $ 2,286
4.28 % $ 1,959
3.88 %
Basic earnings per common share $ 2.71
$ 2.14
$ 1.69
Diluted earnings per common share $ 2.71
$ 2.14
$ 1.69
Cash dividends per share $ 0.87
$ 0.70
$ 0.62
Lowe's Companies, Inc.
Consolidated Statements of Comprehensive Income
(In millions, except percentage data)
January 30,
2015 % Sales
January 31,
2014 % Sales
February 1,
2013 % Sales
Fiscal years ended on
Net earnings $ 2,698
4.80 % $ 2,286
4.28 % $ 1,959
3.88 %
Foreign currency translation adjustments -
net of tax (86 ) (0.15 ) (68 ) (0.13 ) 6
0.01
Net unrealized investment losses - net of tax
—
—
(1 )
—
—
—
Other comprehensive income/(loss) (86 )
(0.15 ) (69 ) (0.13 ) 6
0.01
Comprehensive income $ 2,612
4.65 % $ 2,217
4.15 % $ 1,965
3.89 %
See accompanying notes to consolidated financial statements.
34
This proof is printed at 96% of original size
This line represents final trim and will not print